How Is My Breathing Rate Related to My Pulse?
Have you ever raced after someone, trying to catch up? When you finally caught up, you may have felt your heart pounding, and you were probably out of breath. In this investigation, you will use what you’ve learned about the circulatory and respiratory systems and the purpose of blood to understand the connection between your breathing rate and how fast your heart may be pounding.
Your group will be assigned to a physical activity and work together to collect data on your heart and breathing rates. The task will have these roles: the “timer,” the “runner/jumper” and the “pulse keeper.” The “pulse keeper” should be the one who can find the pulse the easiest on the other person’s wrist. You should practice taking these rates a few times before you begin investigating.
Record your data at rest and after 1 minute of the activity. Then make a table to show your findings. Be sure to include titles for the columns and rows. Next, use your data table to create a double-line graph that shows both rates and what you discovered about the relationship between breathing rate and pulse. Your conclusions should tell whether your prediction was supported by the data.
Two or three 45-minute periods.
Instructional Support Downloads
Suggested materials
I had the following materials available for this activity: jump ropes, stopwatches, a space for physical activity, graph paper and rulers. Students also had recording sheets.
I also suggest access to computers so that students can enter their data and create an electronic graphic representation for the data displays.
Task Menu Quick Links

Exemplars Rubrics
The student should include a hypothesis, which states whether or not breathing rate is related to pulse. There should be some evidence of prior knowledge (of either the circulatory or respiratory system). The data table includes columns and rows, labels and a title. Data for breathing rate and pulse rate are for at least three time frames. The data are accurately translated from the table and plotted on a graph (with title and accurate scale and labels for the axes of the graph). There should be a key on the graph to distinguish the two lines.
Conclusions accurately compare the breathing rate to the pulse rate and cite evidence from the data collected to support or refute the hypothesis. The student gives a reasonable explanation of how s/he effectively used breathing rate, pulse and a stopwatch to measure these rates.
| Toy | Speed | Path | Time |
| Ladybug | Slow | Circle | 13 seconds |
| Penguin | Slow | Zigzag | 1 minute |
| Turtle | Medium | Straight | 10 seconds |
| Dinosaur | Slow | Straight | 30 seconds |
| Praying mantis | Fast | Straight | 32 seconds |
| Robot | Slow | Straight | 28 seconds |
| Dog | Fast | Straight | 2 seconds |
| Kangaroo | Fast | Straight/Flips | 15 seconds |
| Rhino | Fast | Zigzag | 15 seconds |
Note: I usually score this type of assignment (one having many different parts to it) with points given for each section. This approach is called analytic scoring rather than holistic scoring. I do this because many students can have, for example, a solid hypothesis and then a weak conclusions section, or an incomplete data table. Then I look to see where the strengths lie and try to weight the parts with the most important information a little more. This gives me the final holistic performance levels: Novice, Apprentice, Practitioner and Expert.
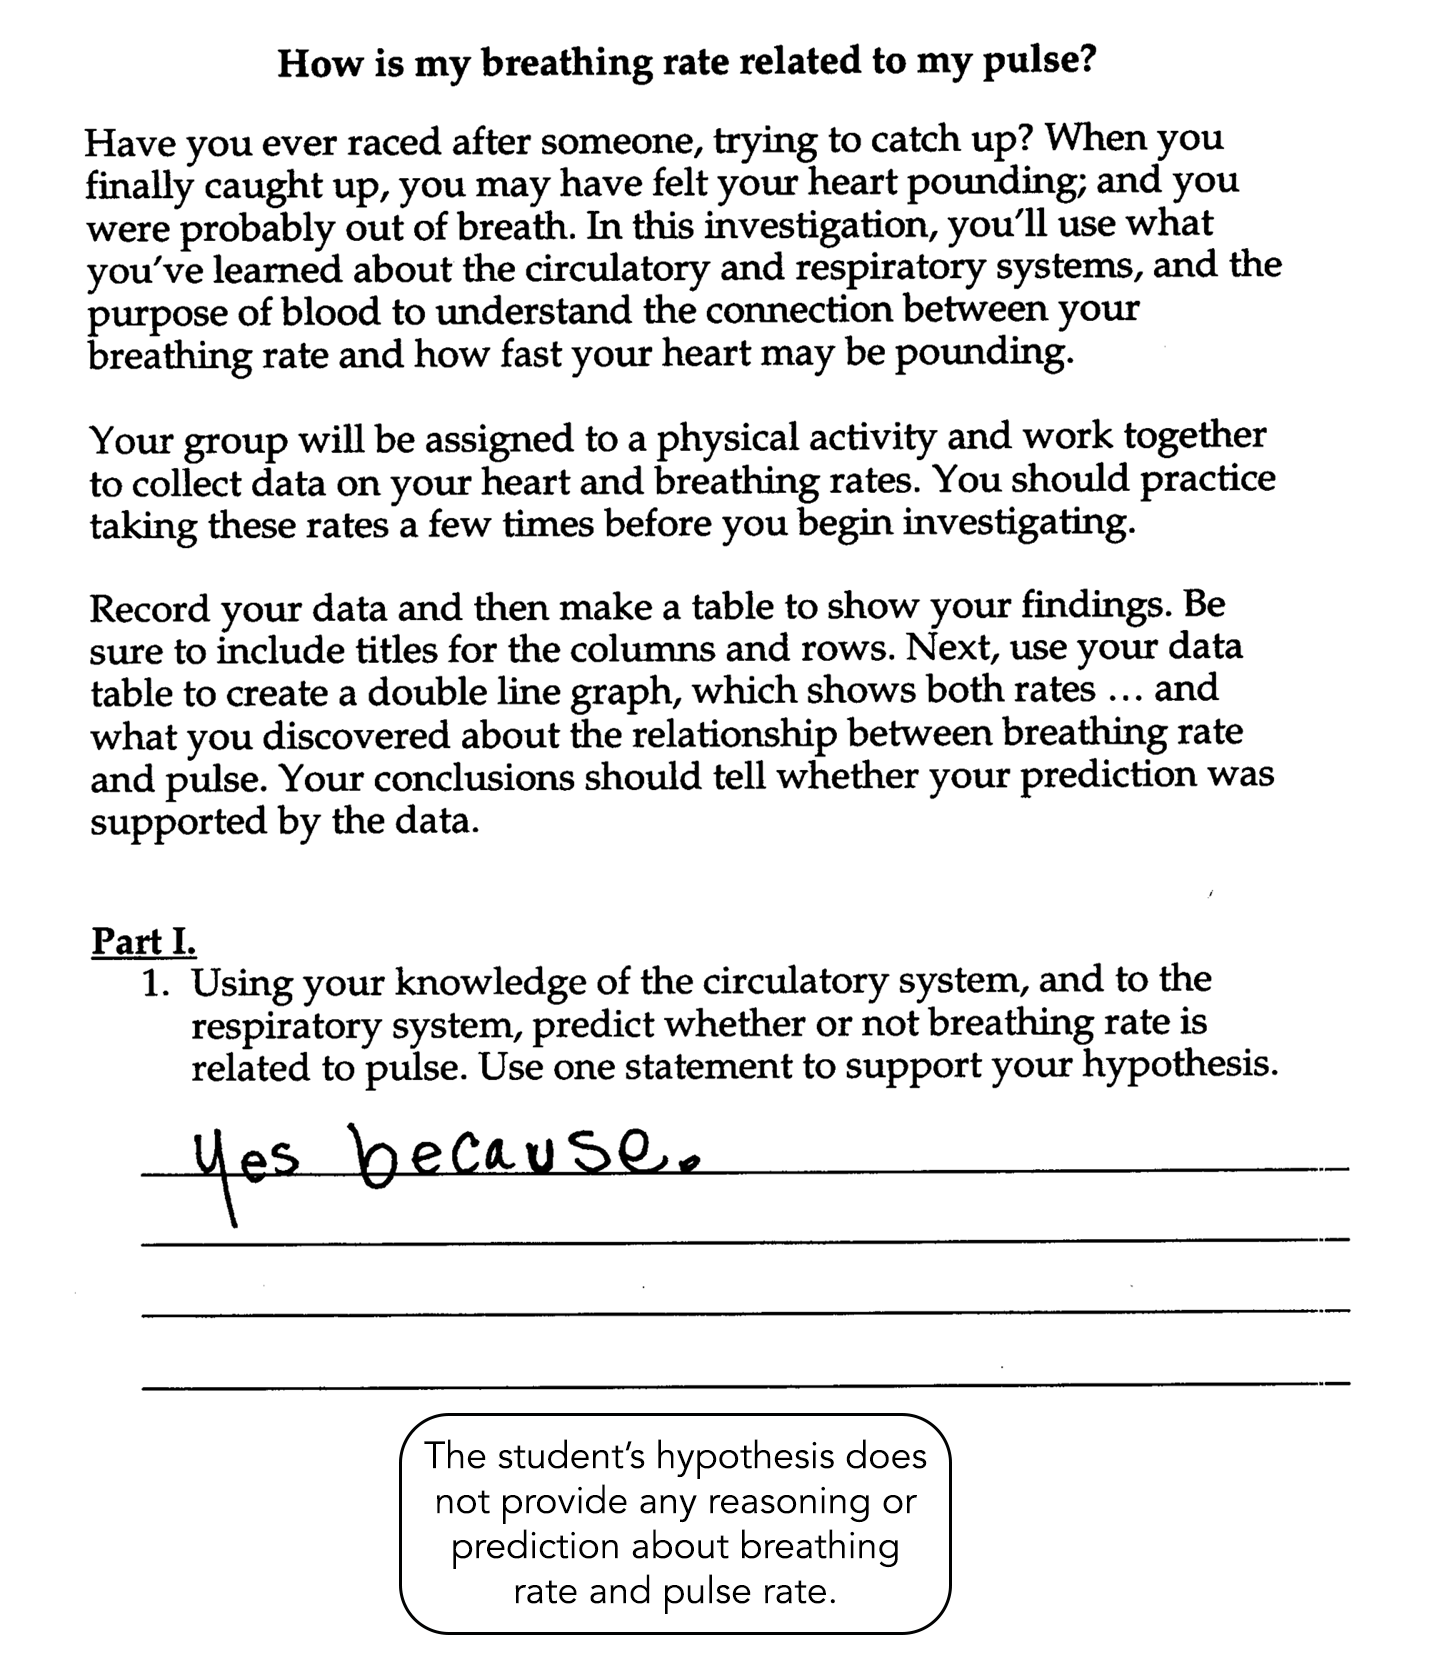
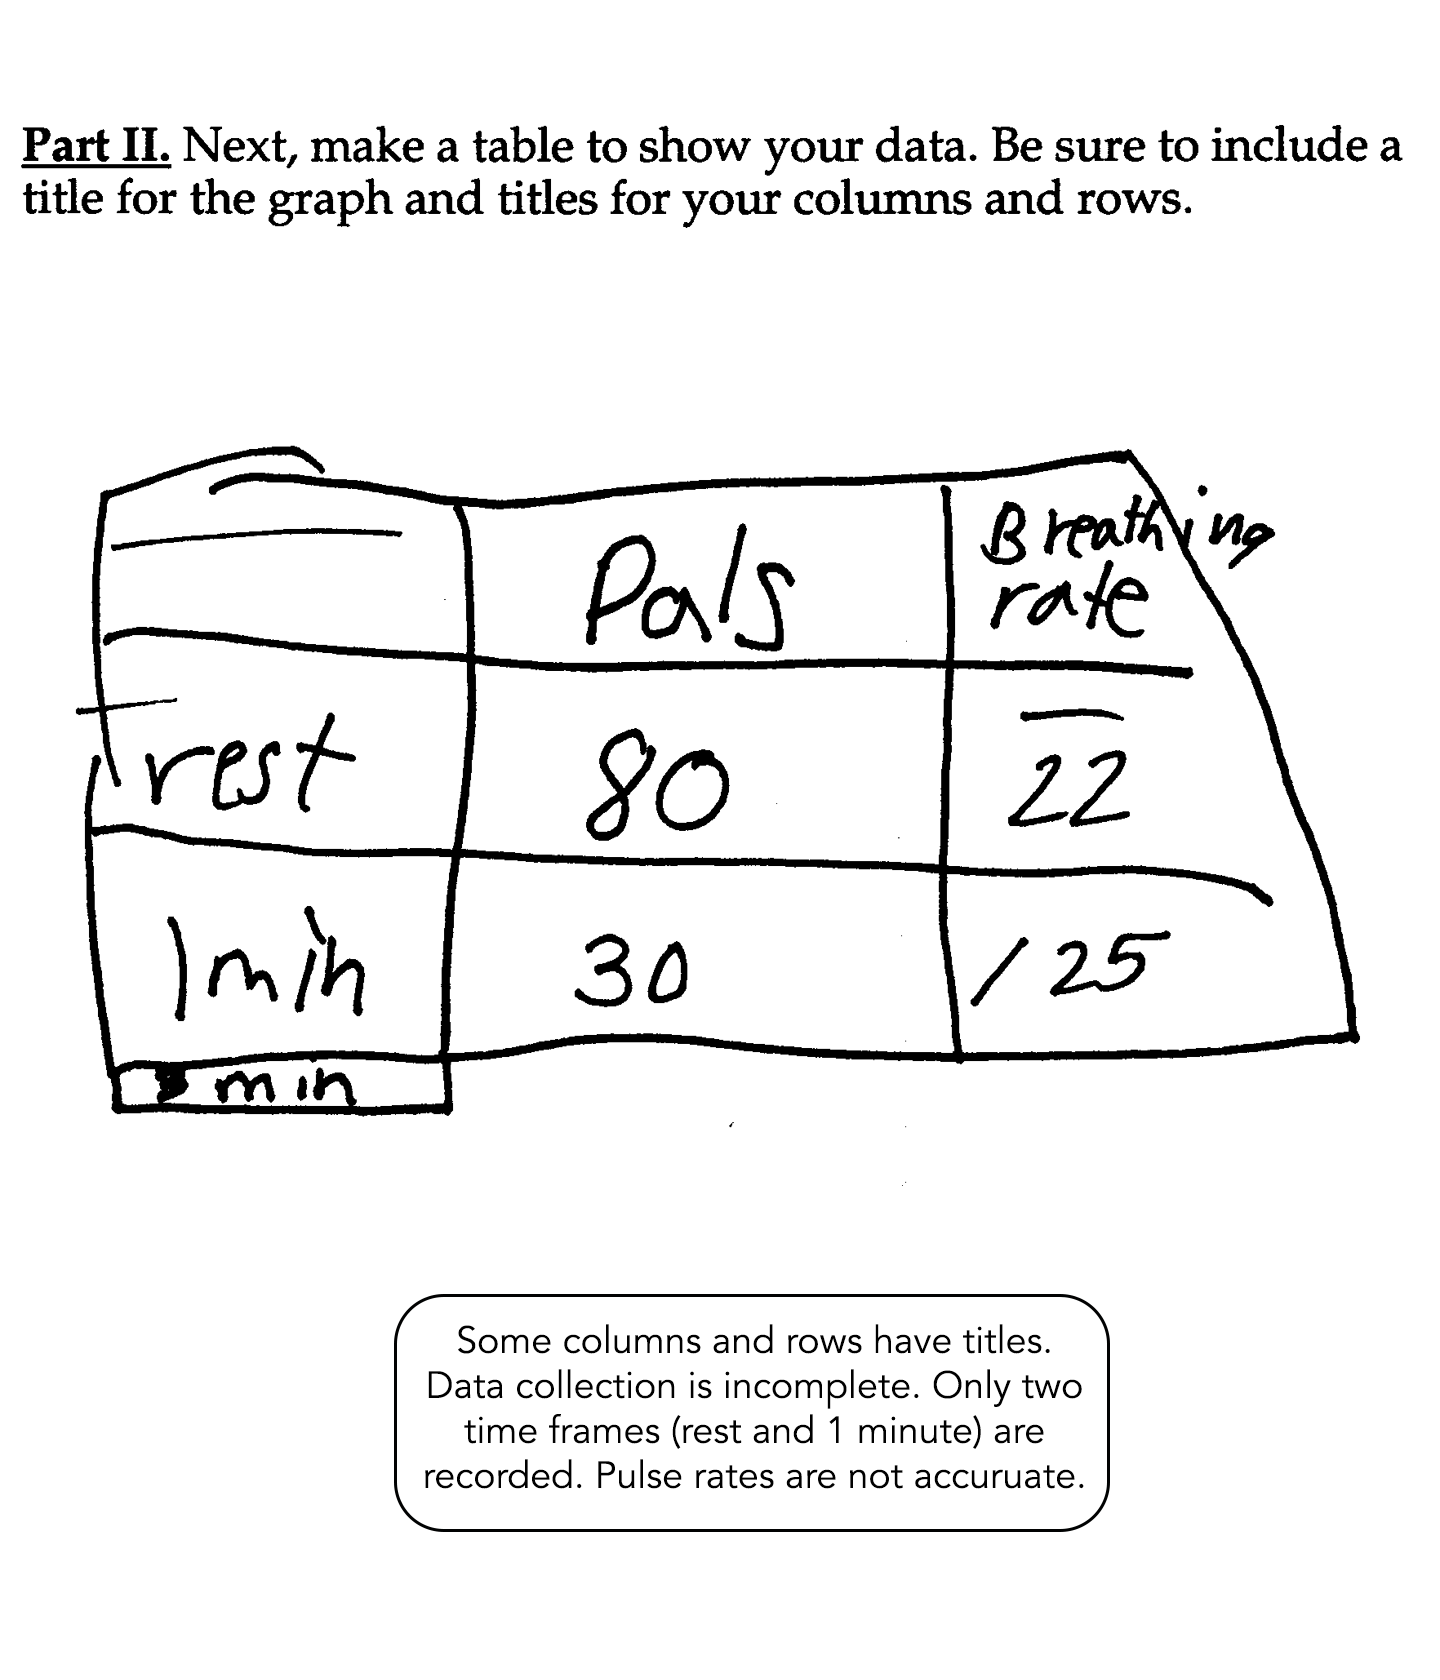
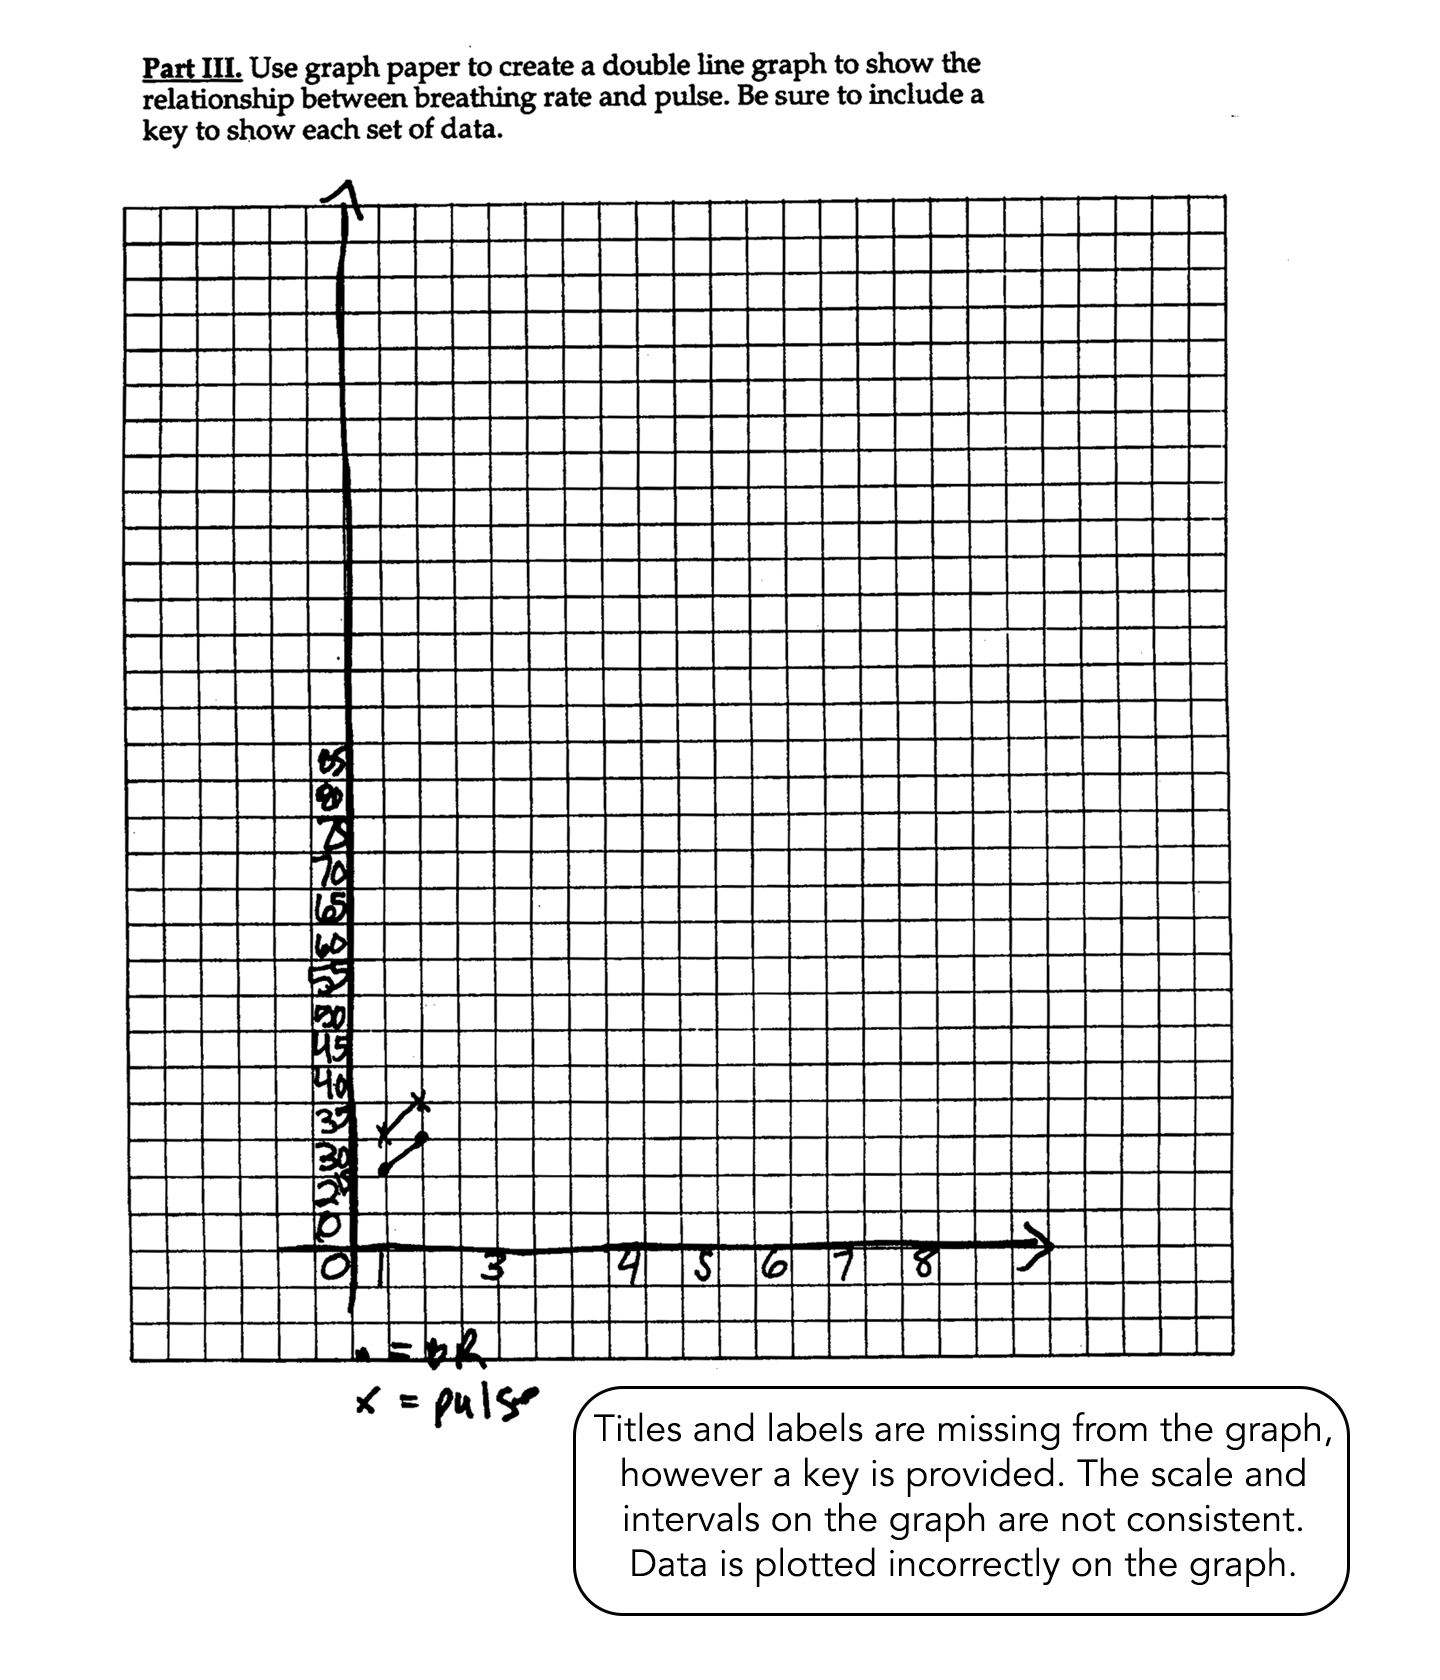
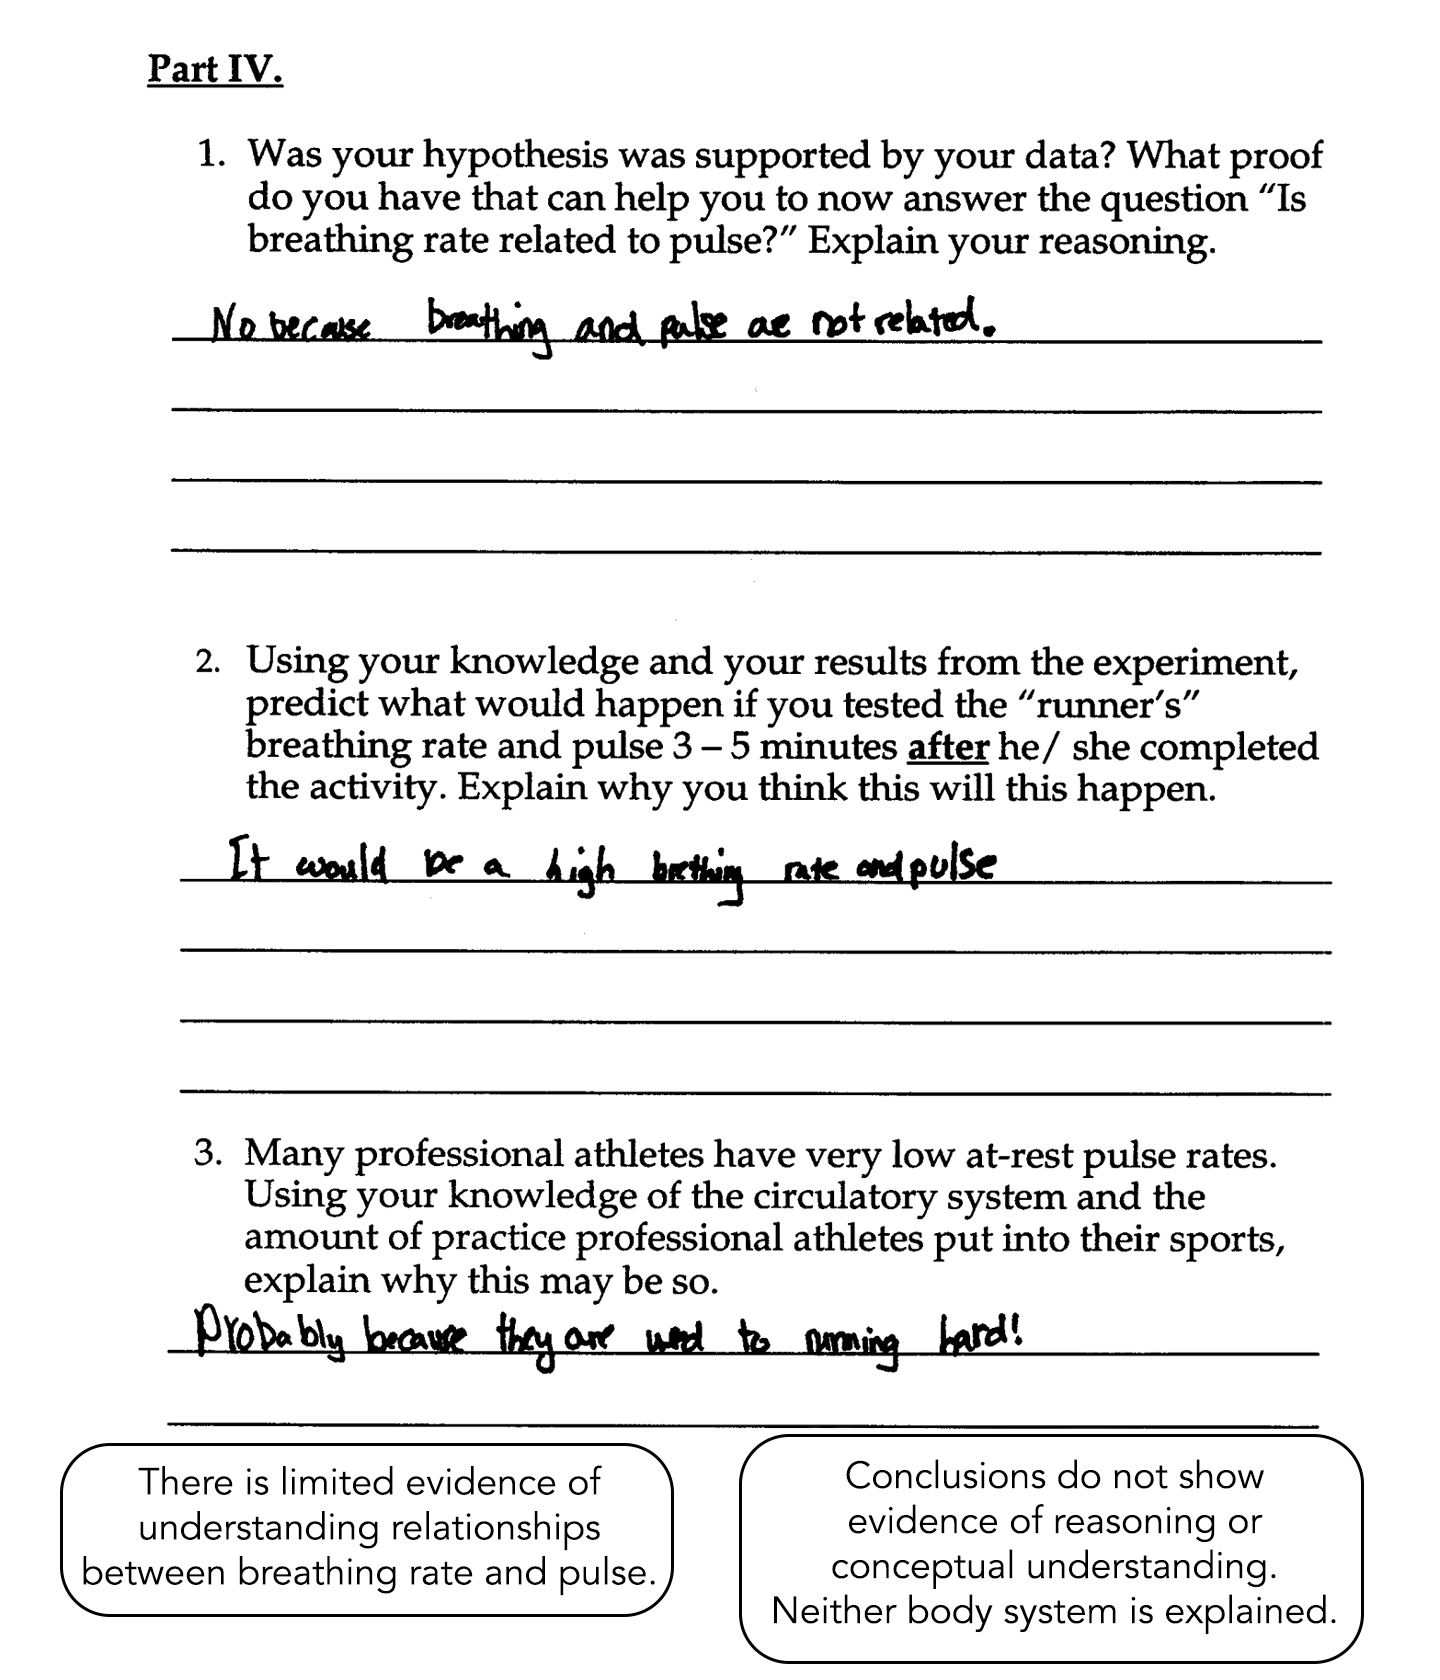
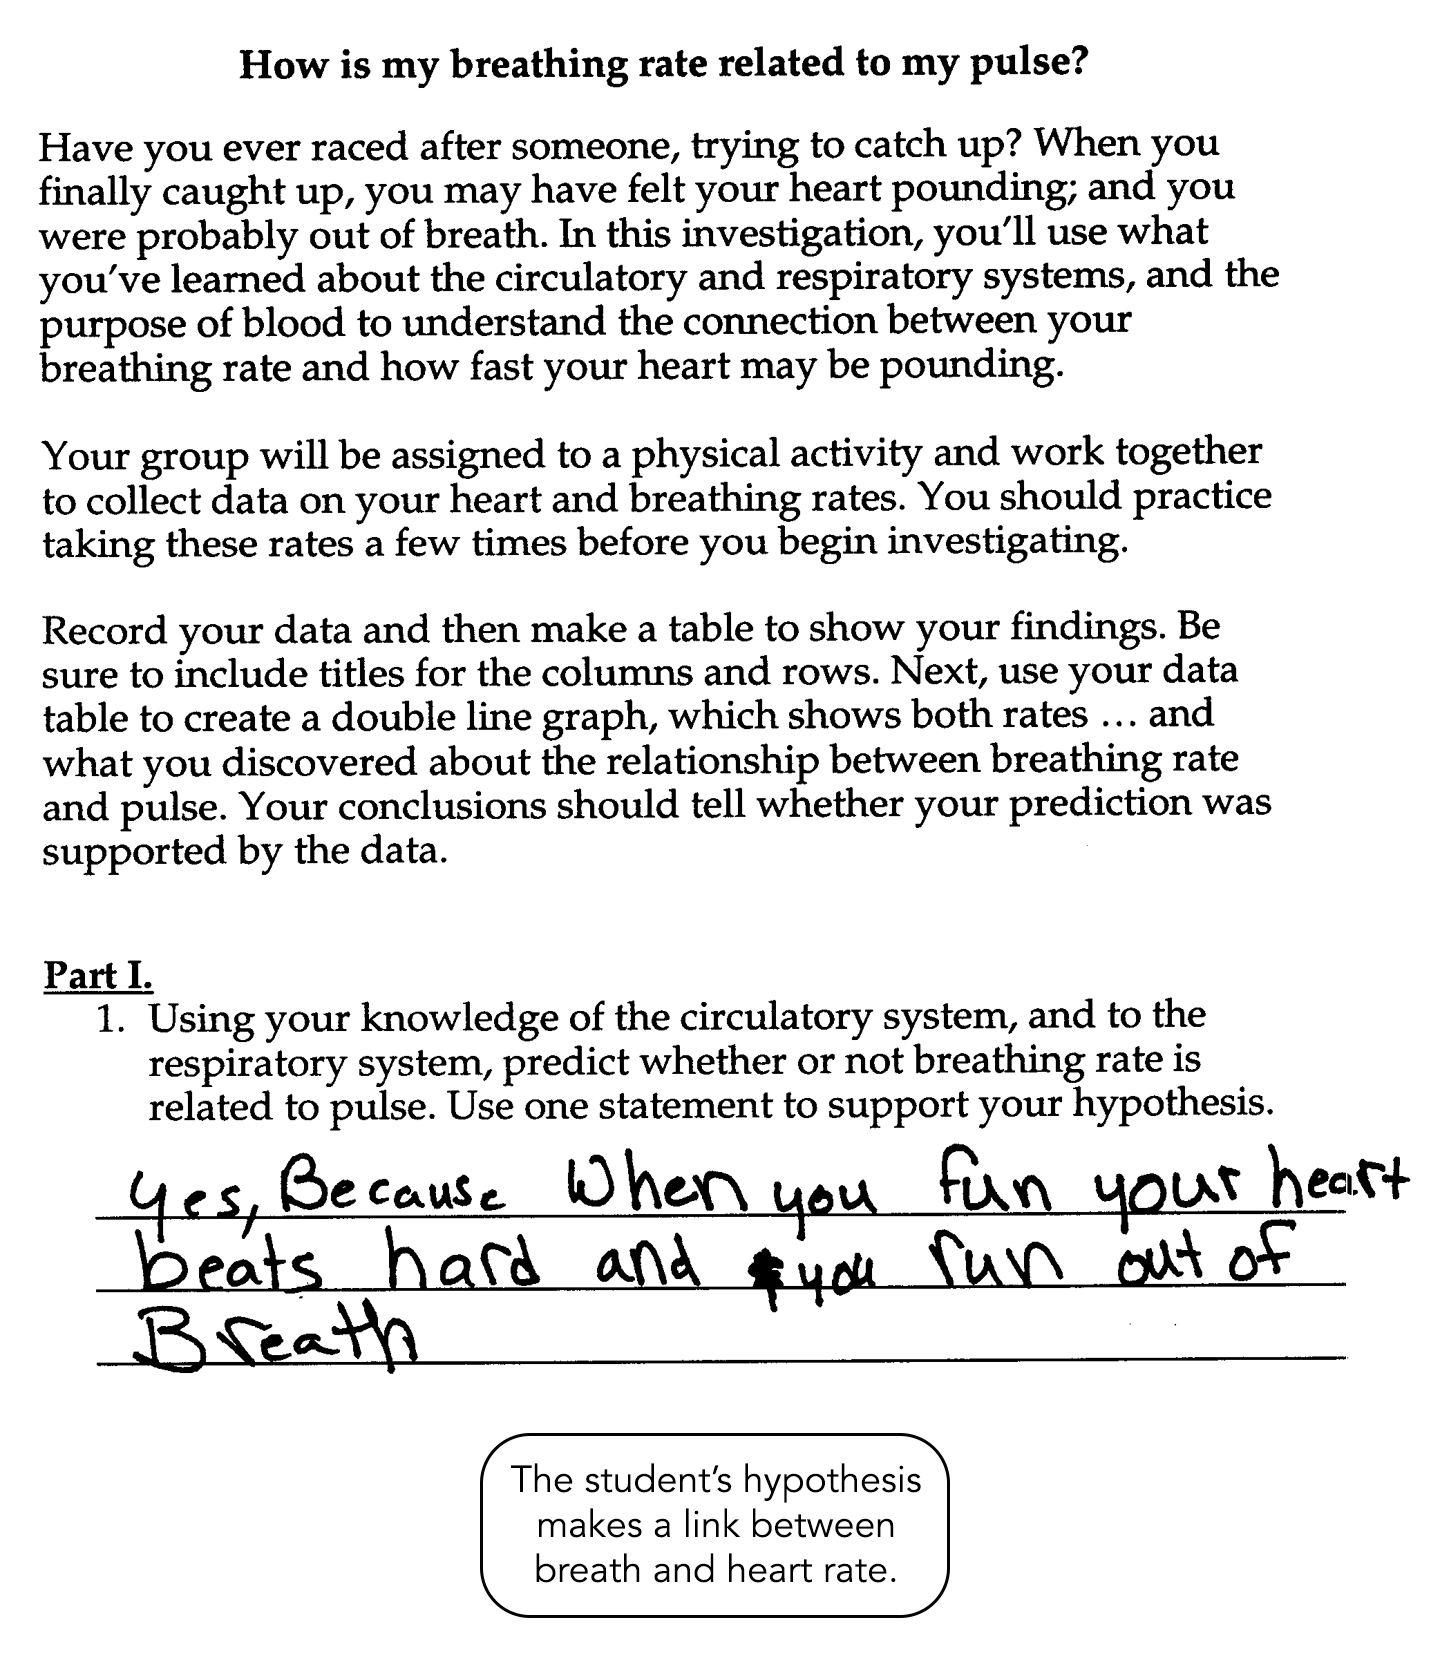
The student’s hypothesis is only a one-word answer, “yes.” It does not state any prediction or reasoning about breathing rate or pulse rate rising or falling. There is no evidence of knowledge of the circulatory or respiratory systems. Data table and data collection are incomplete. Only two time frames are recorded. The rates appear to be inaccurate, being that the pulse rate at rest is recorded as = 80 and after one minute of exercise, it is only = 30. Some columns and rows have titles. Titles and labels are missing from the graph, although a key is included. The scale and intervals on the graph are inconsistent. Data are plotted incorrectly on the graph. Conclusions do not show evidence of reasoning or conceptual understanding. Neither the circulatory system nor the respiratory system is explained in the conclusion. There is only limited evidence of understanding the relationship between breathing rate and pulse.
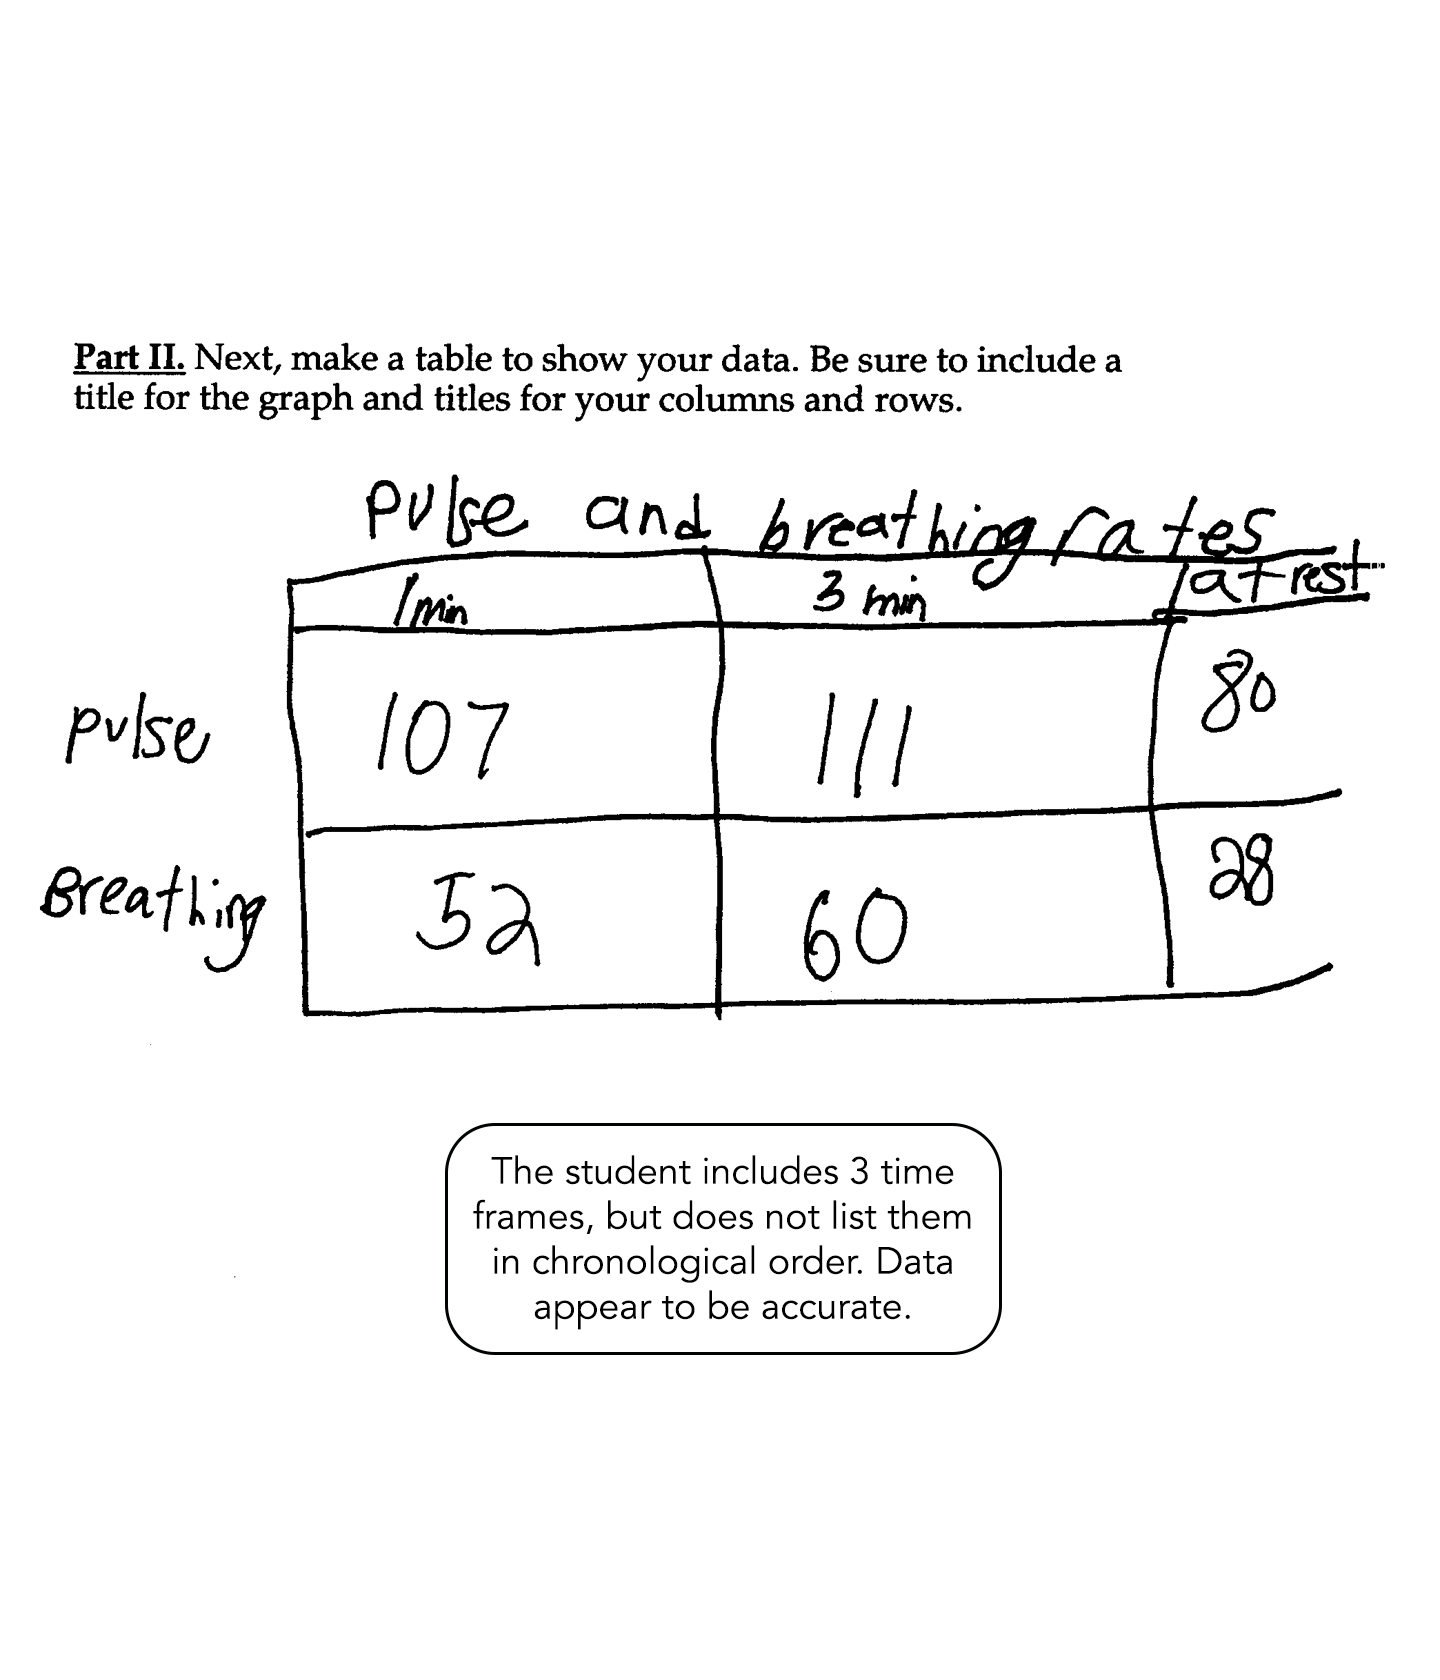
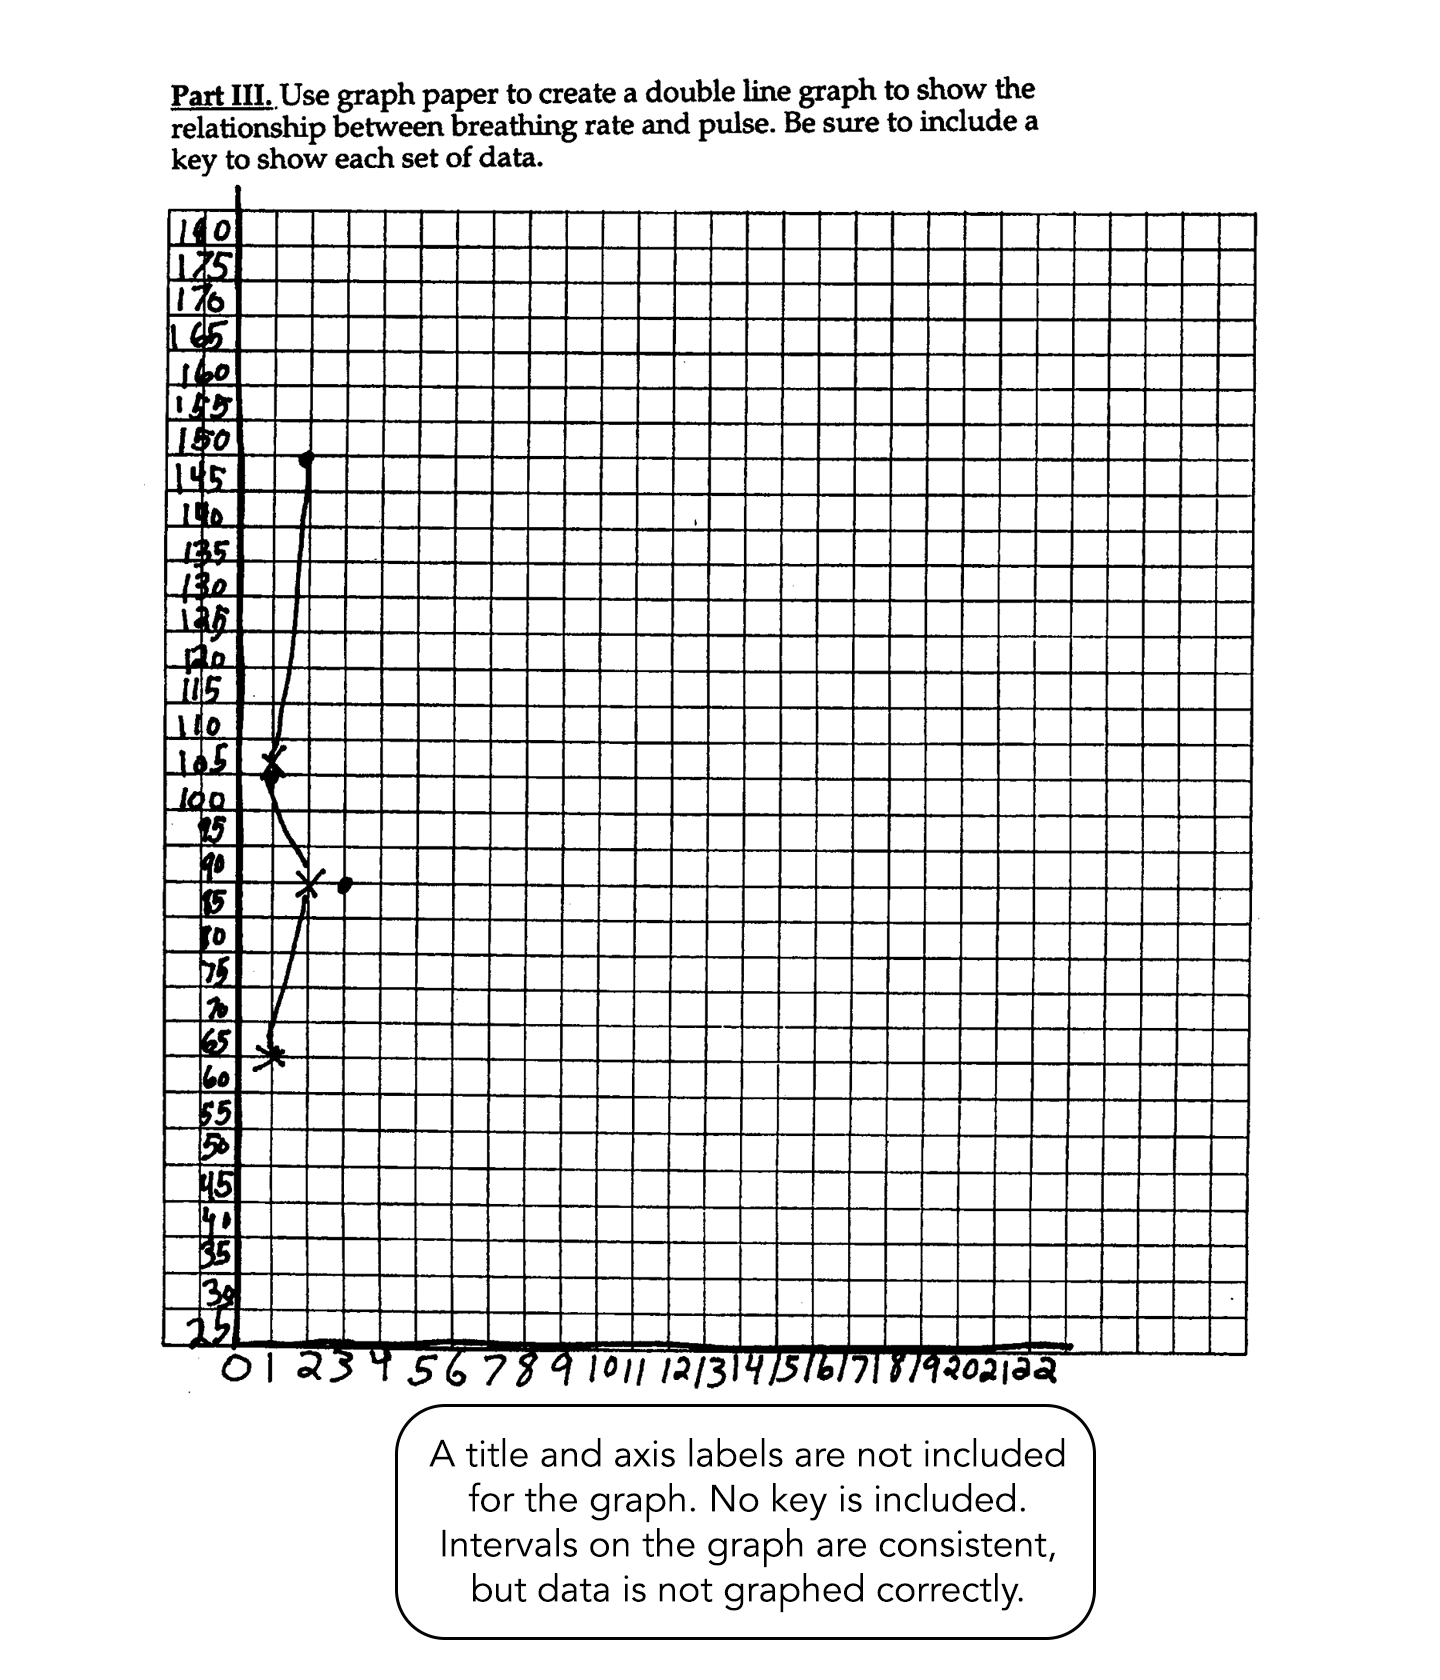
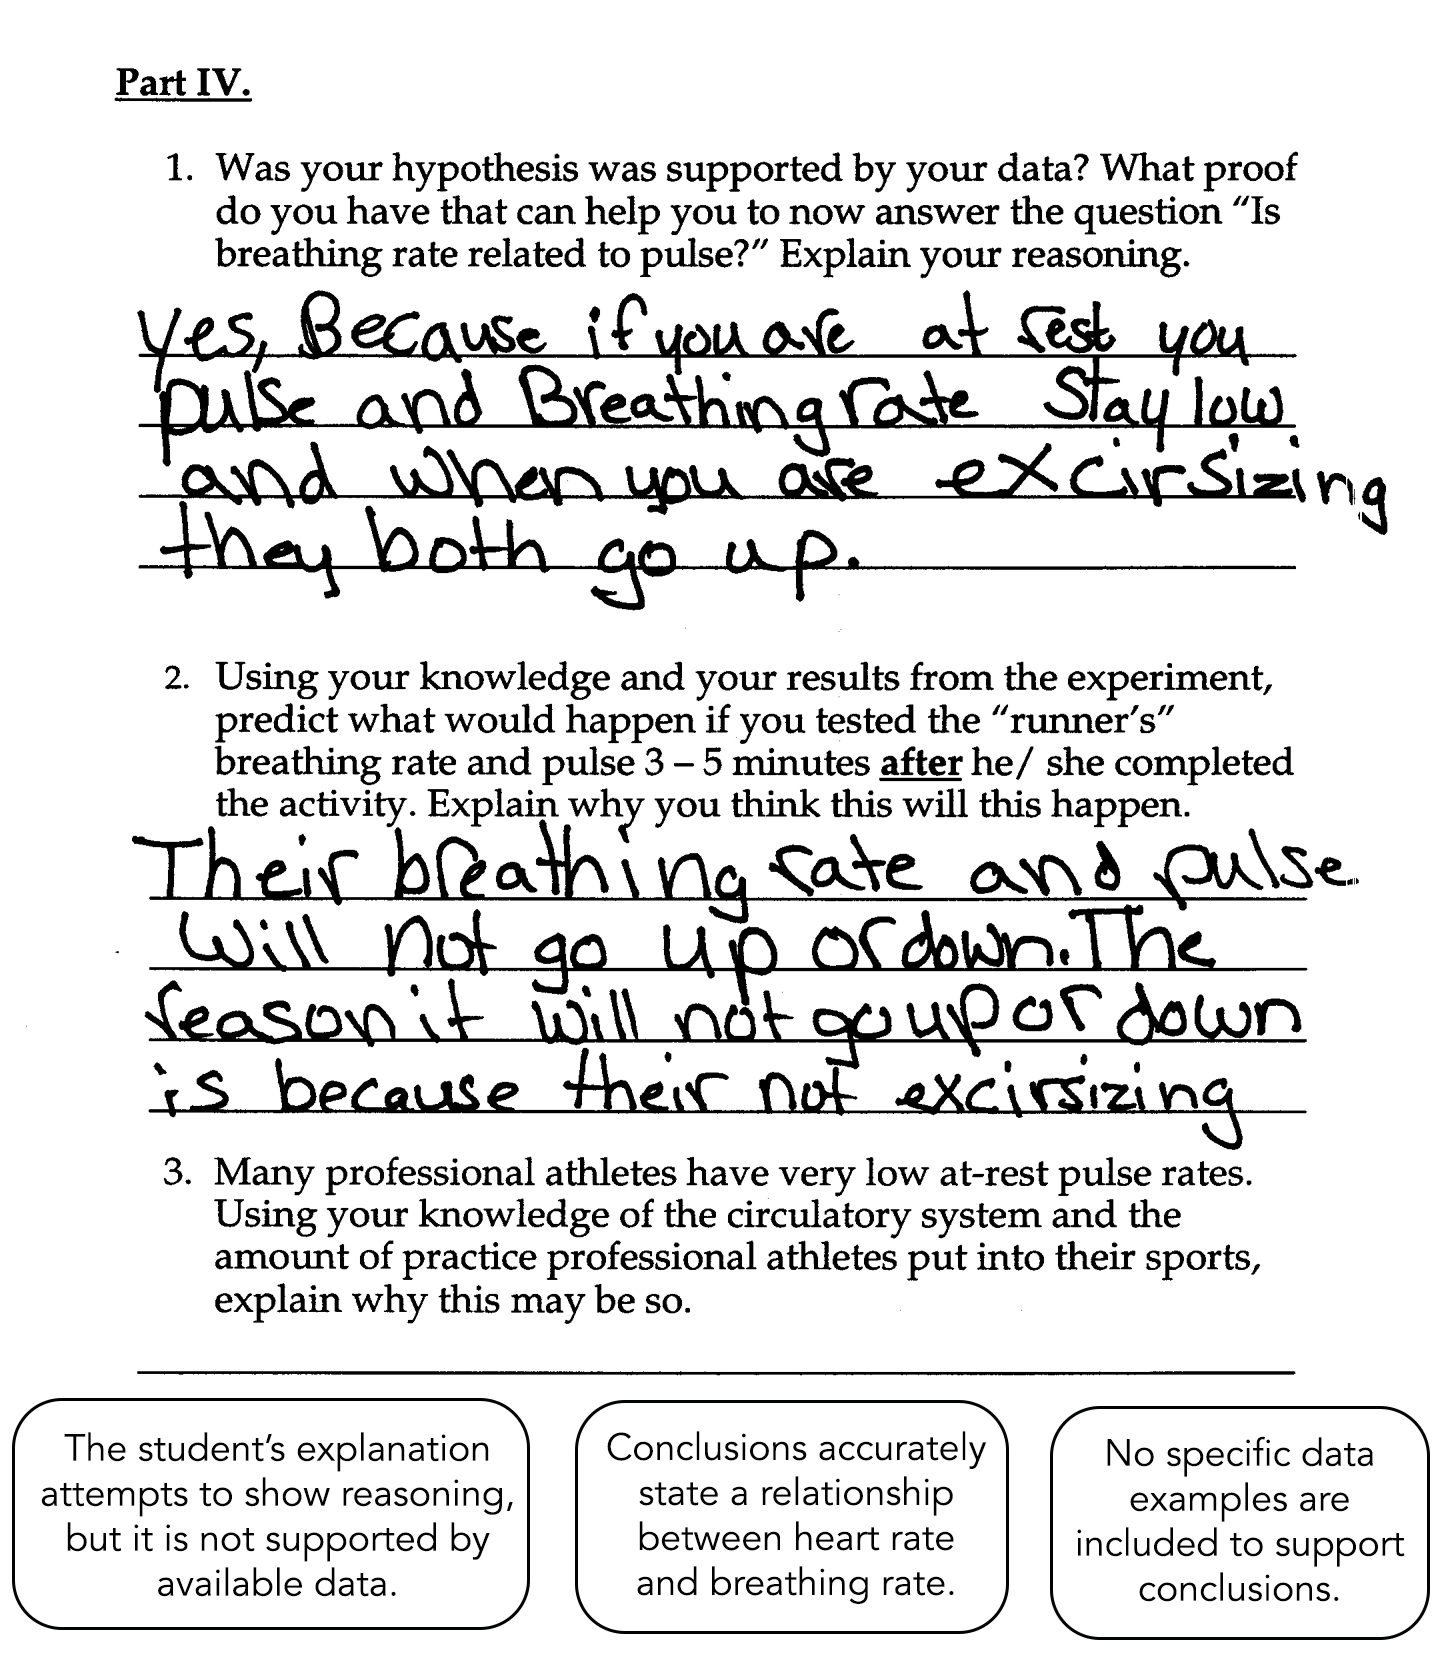
The student’s hypothesis states whether or not breathing rate is related to pulse. The data table includes a title and labels for the columns and rows but does not have data in chronological order (from at rest to three minutes). The table includes data for breathing rate and pulse rate for a minimum of three time frames. Data appear to be accurate and complete. A title and axes labels are not included for the graph. No key is included. The intervals for each axis of the graph are consistent, but the data are not shown correctly on the graph. Conclusions accurately compare the breathing rate to the pulse rate. This student’s solution is lacking in detail, in that no specific examples from the data are used to support the conclusions. The student’s explanation attempts to show reasoning but is not supported by data collected. The explanation does not show a cause-effect relationship and is not consistent with the available data.
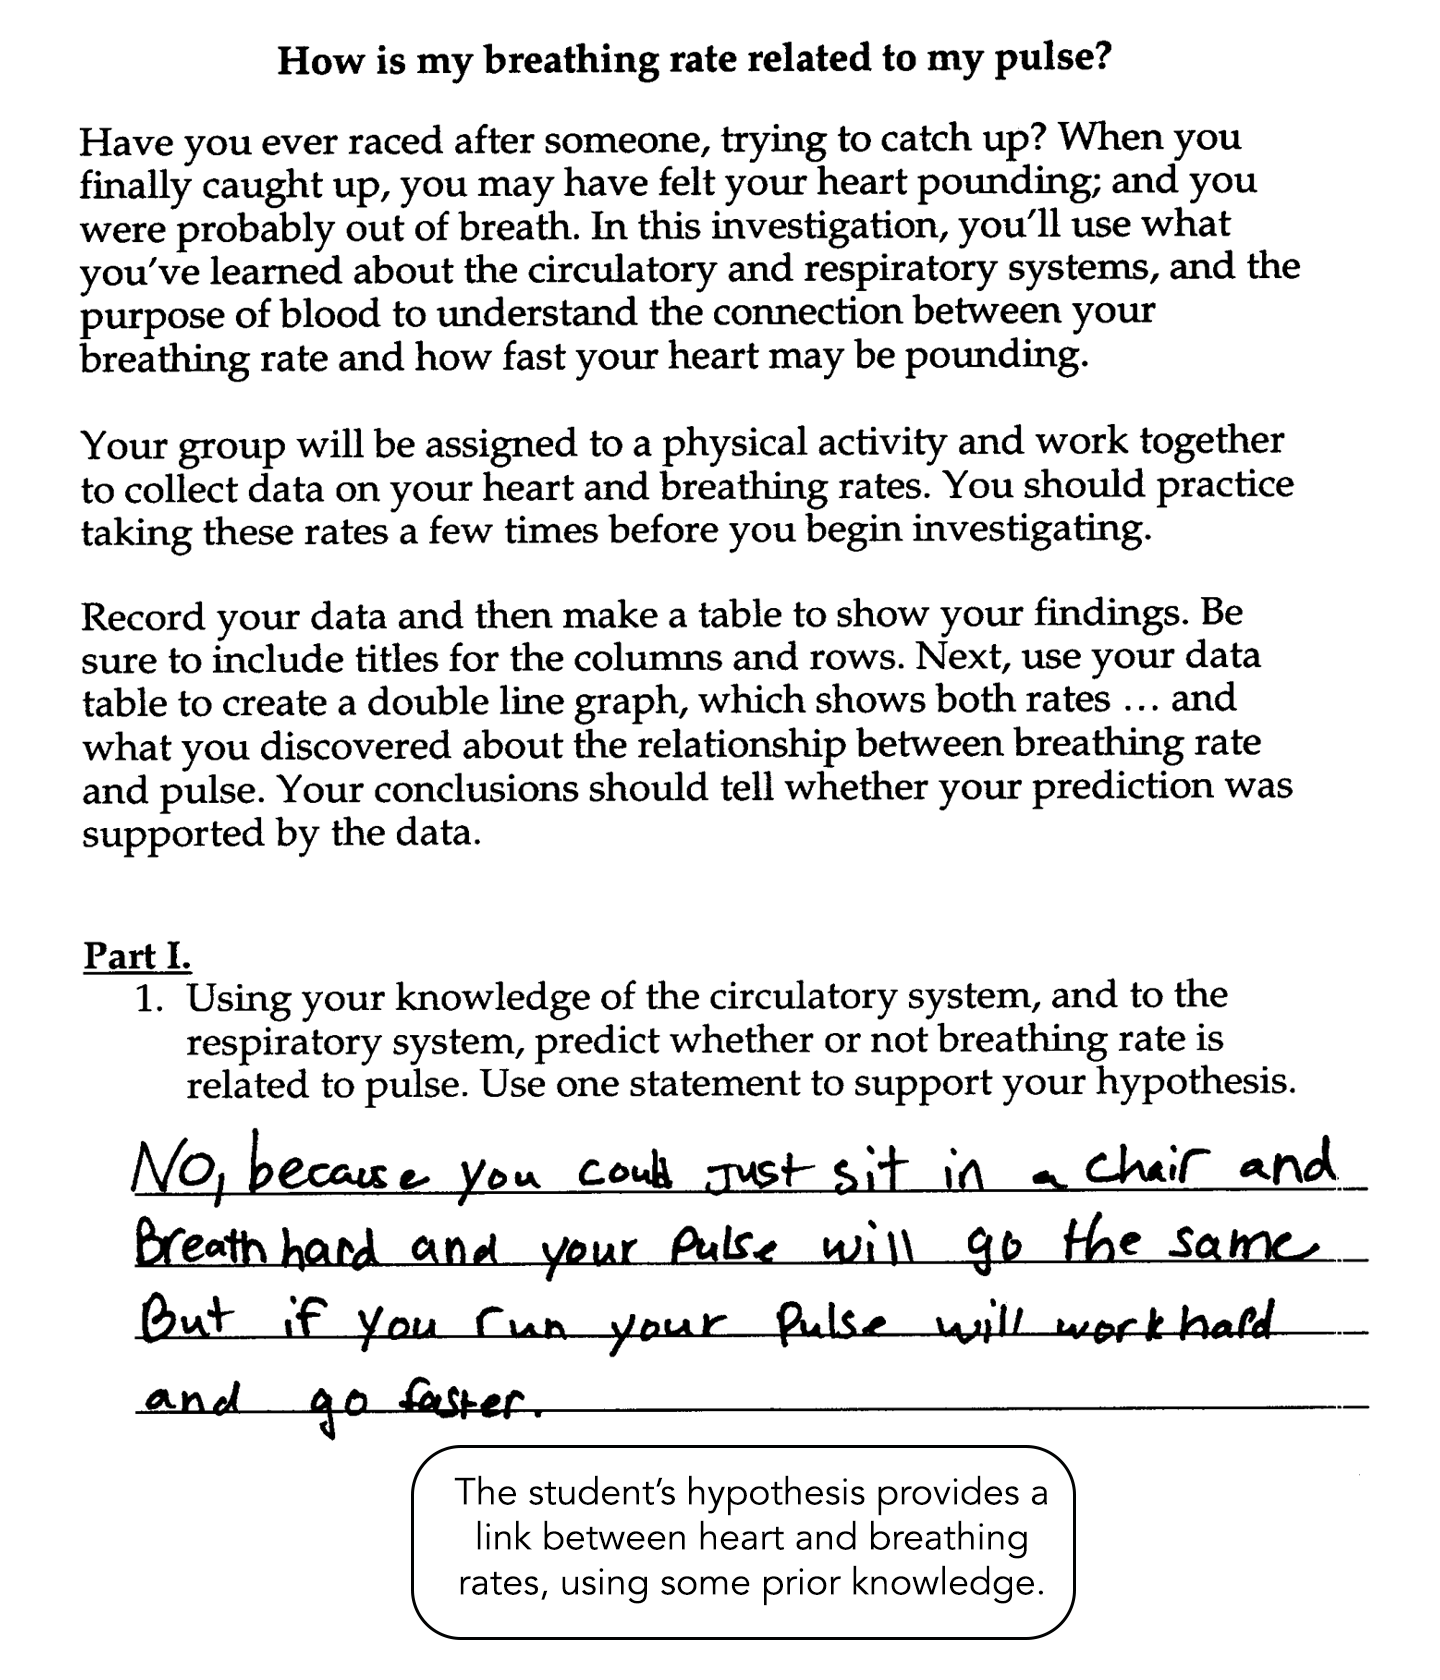
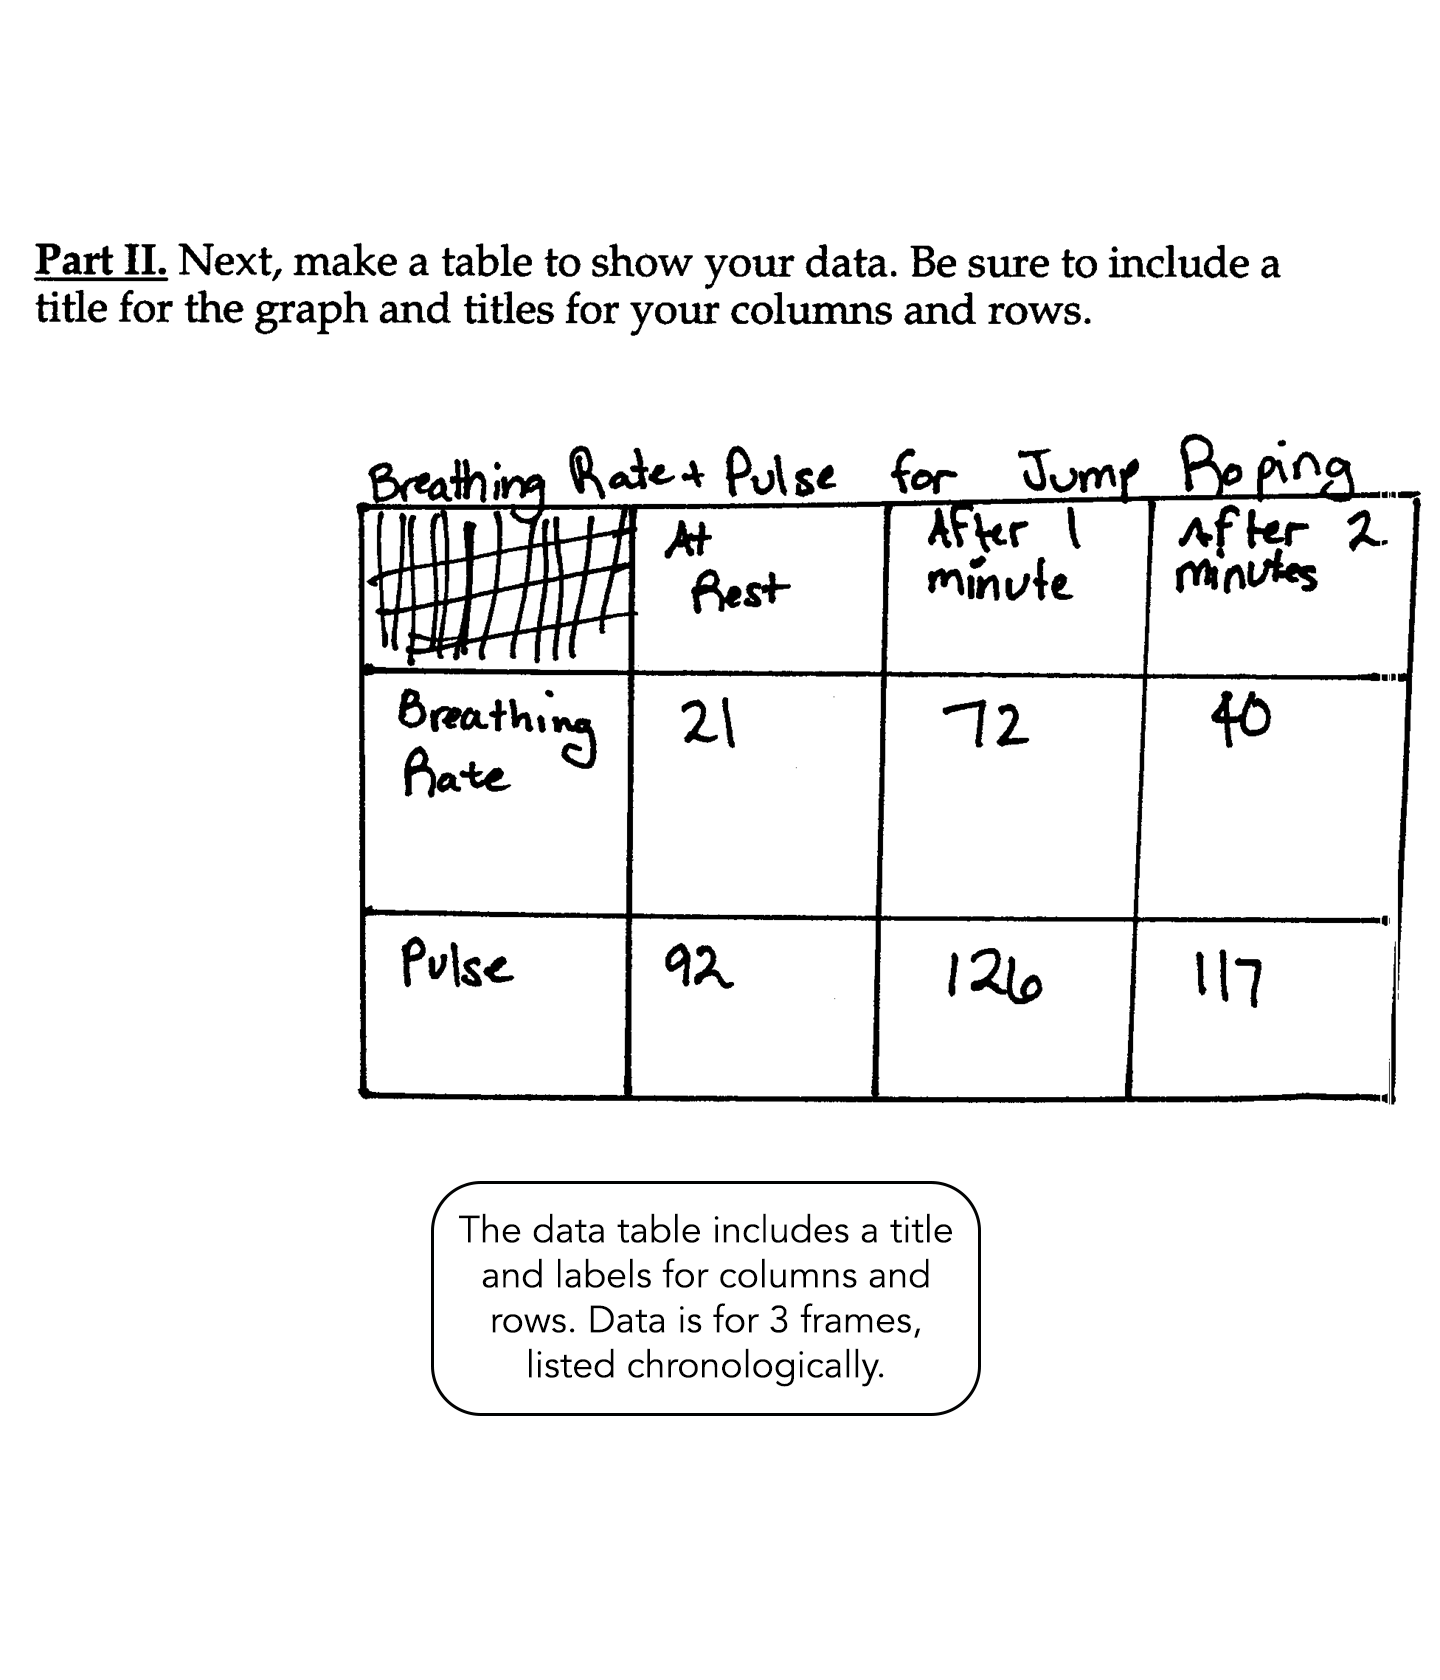
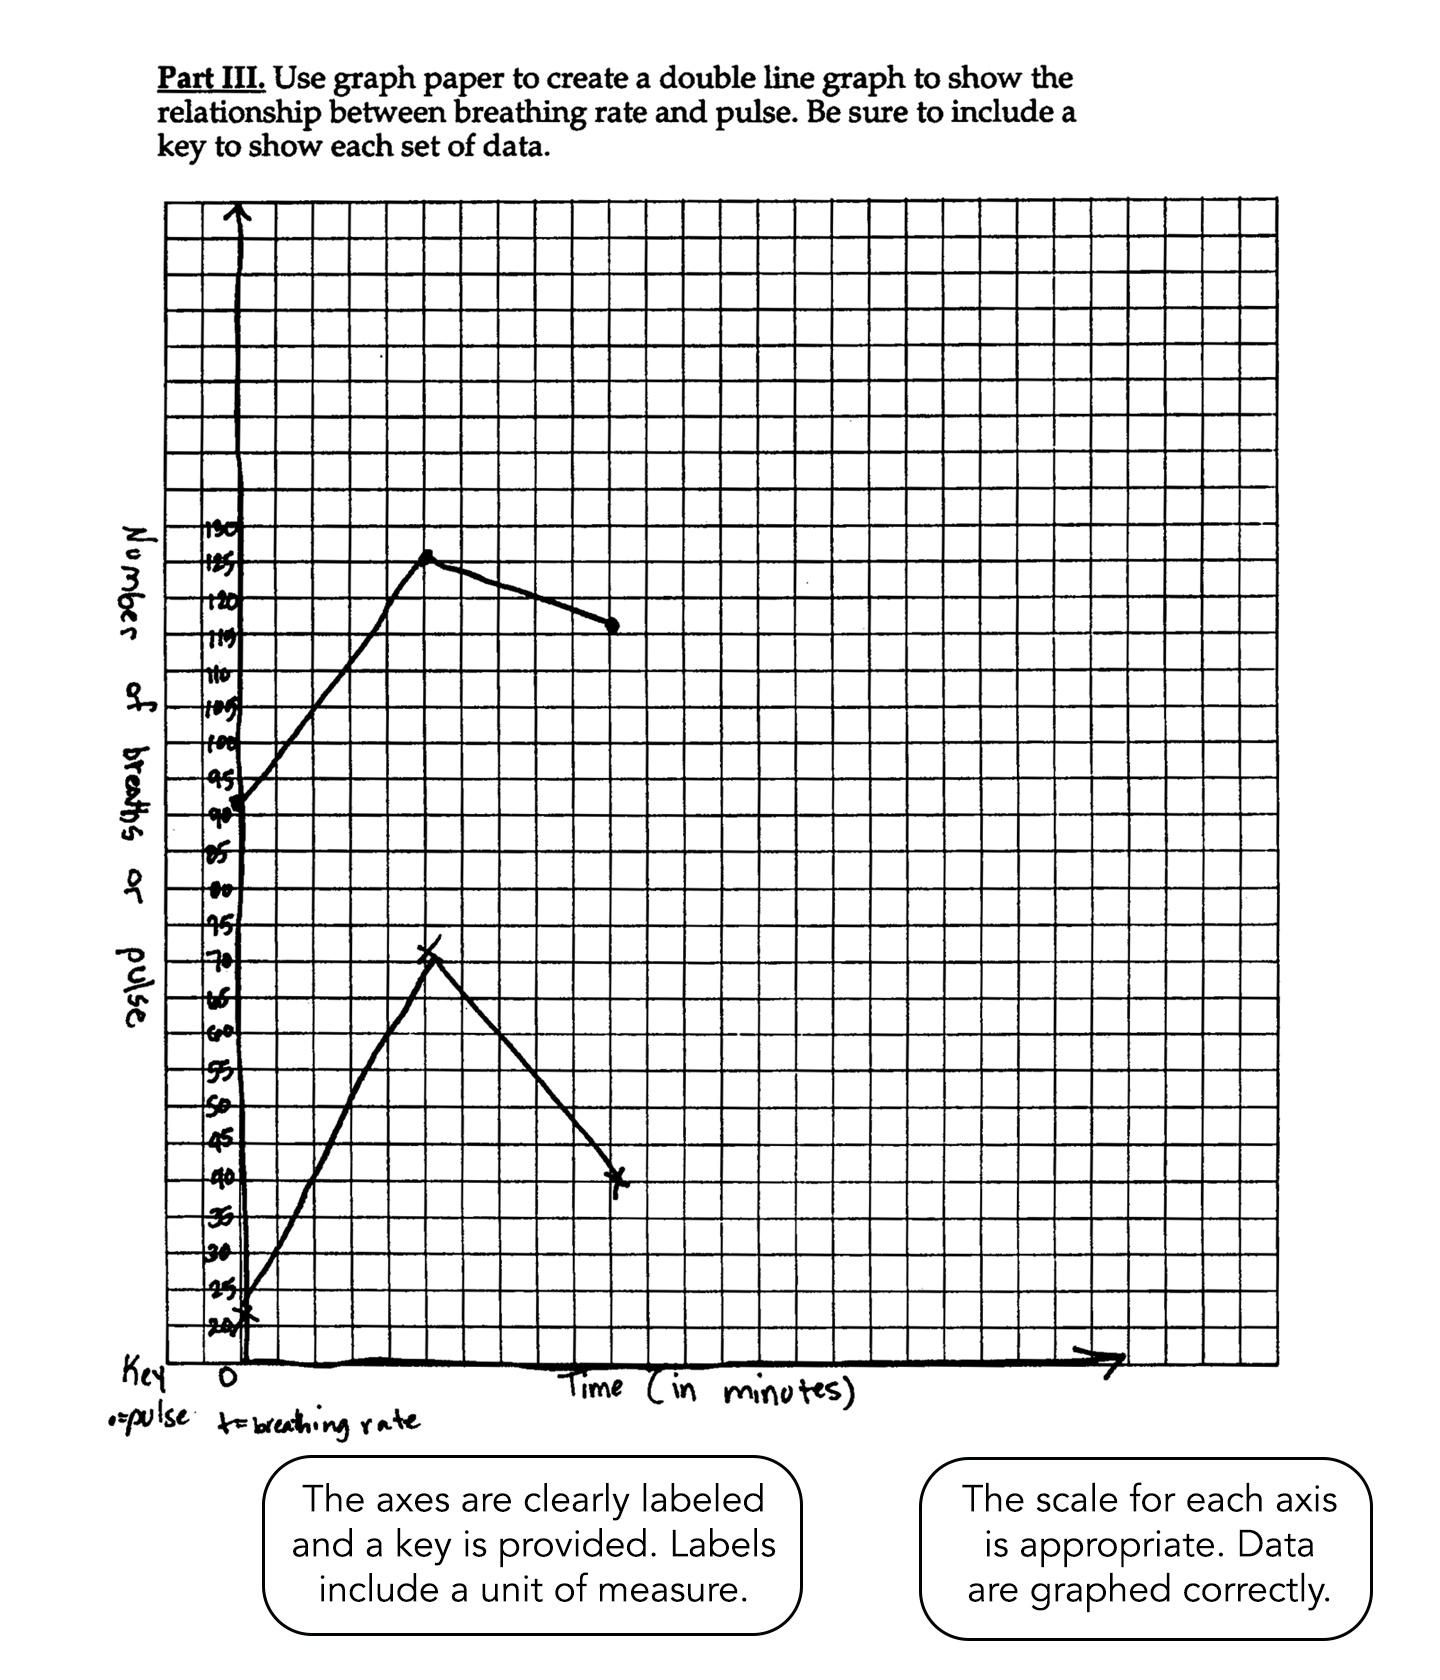
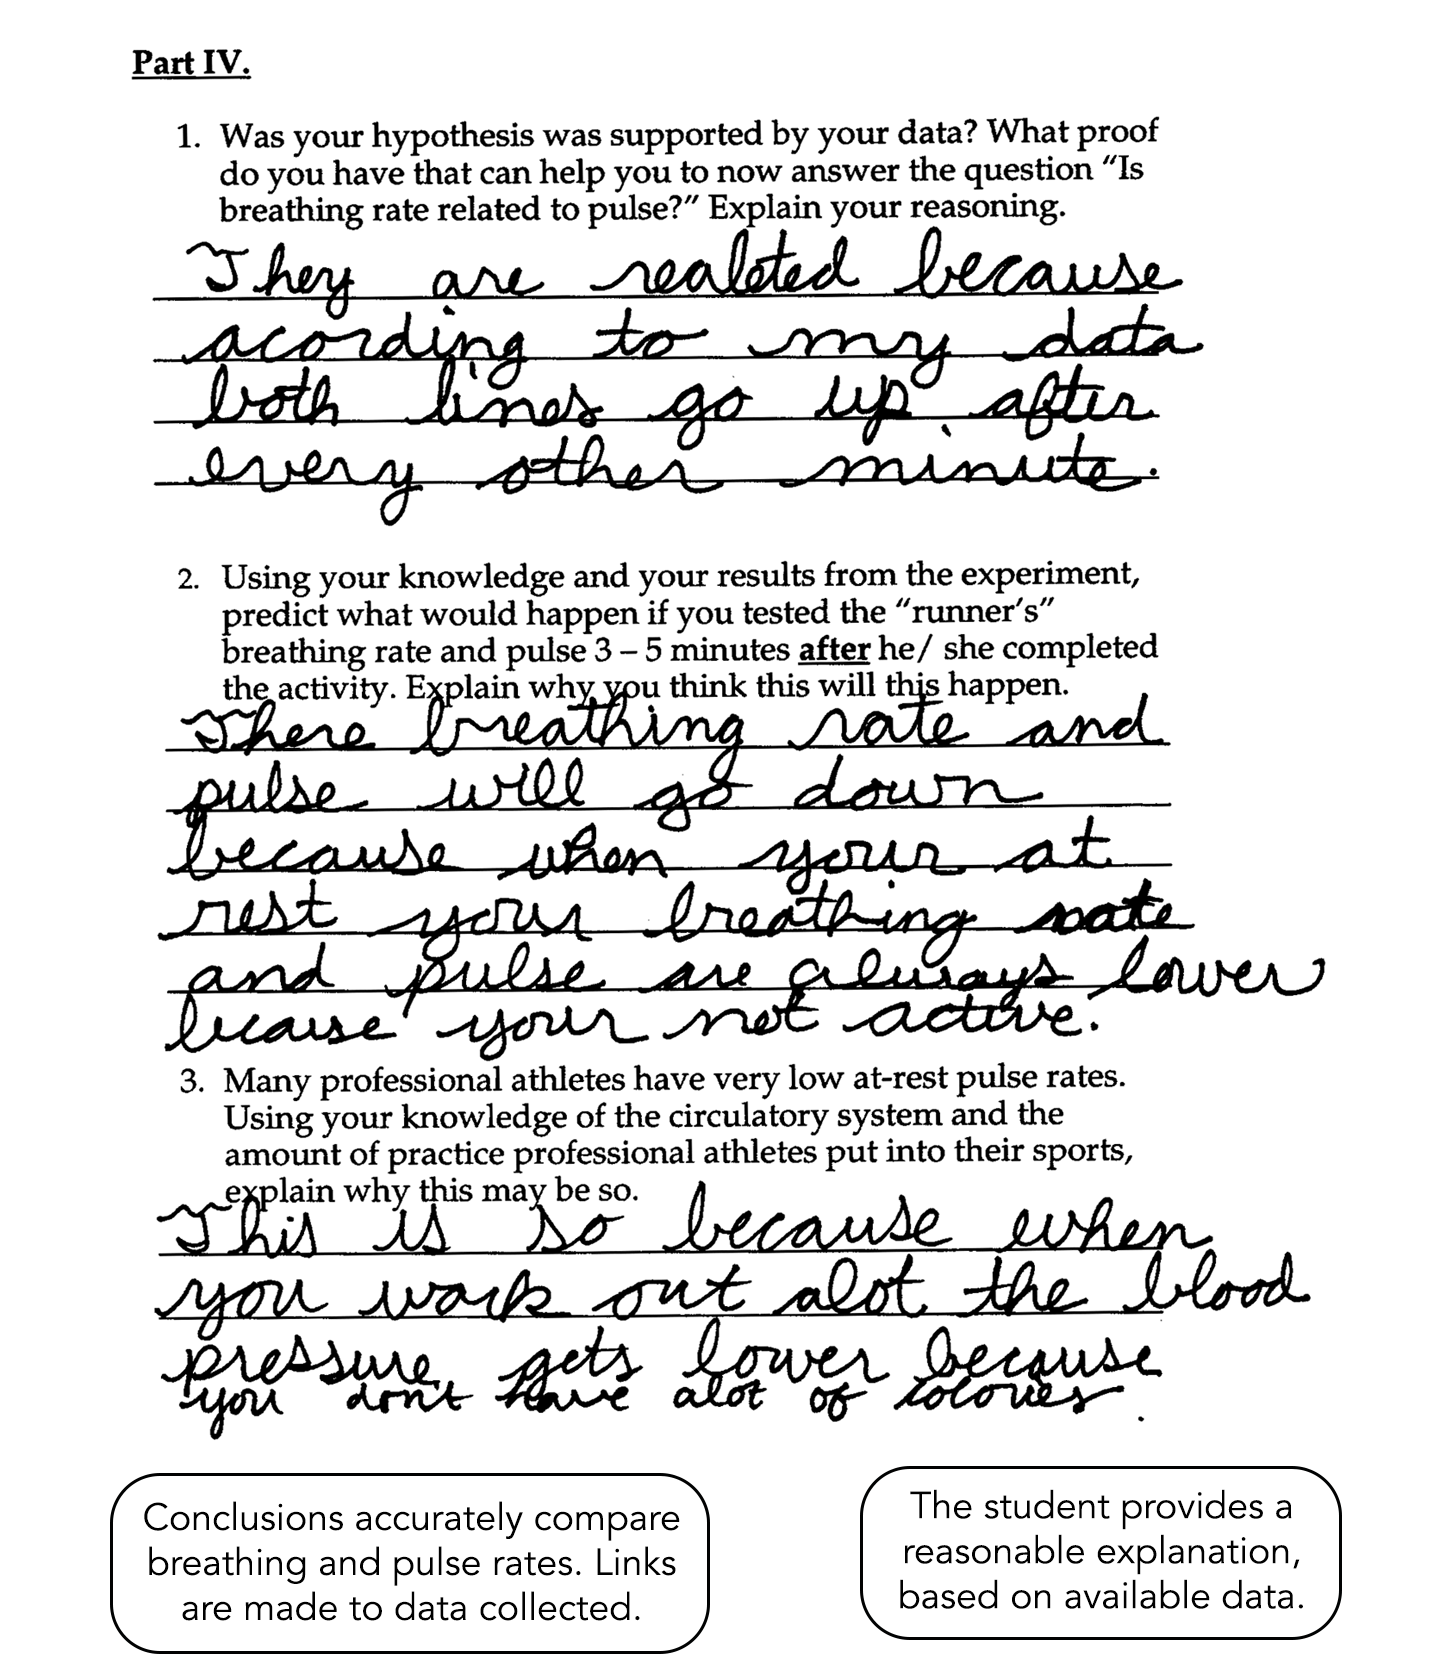
The student’s hypothesis states whether or not breathing rate is related to pulse and includes some prior knowledge of the circulatory and the respiratory systems. The data table includes columns and rows, labels and a title. The table includes data for breathing rate and pulse rate for at least three time frames, recorded chronologically. Labels for the axes of the graph are accurate (including measurement). The scale for each axis is appropriate for the data collected and is shown correctly on the graph. The data are accurately translated from the table and plotted on the graph. A key is included on the graph to distinguish the two lines. Conclusions accurately compare the breathing rate to the pulse rate. The student clearly cites evidence from the data collected to support or refute the hypothesis. The student gives a reasonable explanation based on available data.
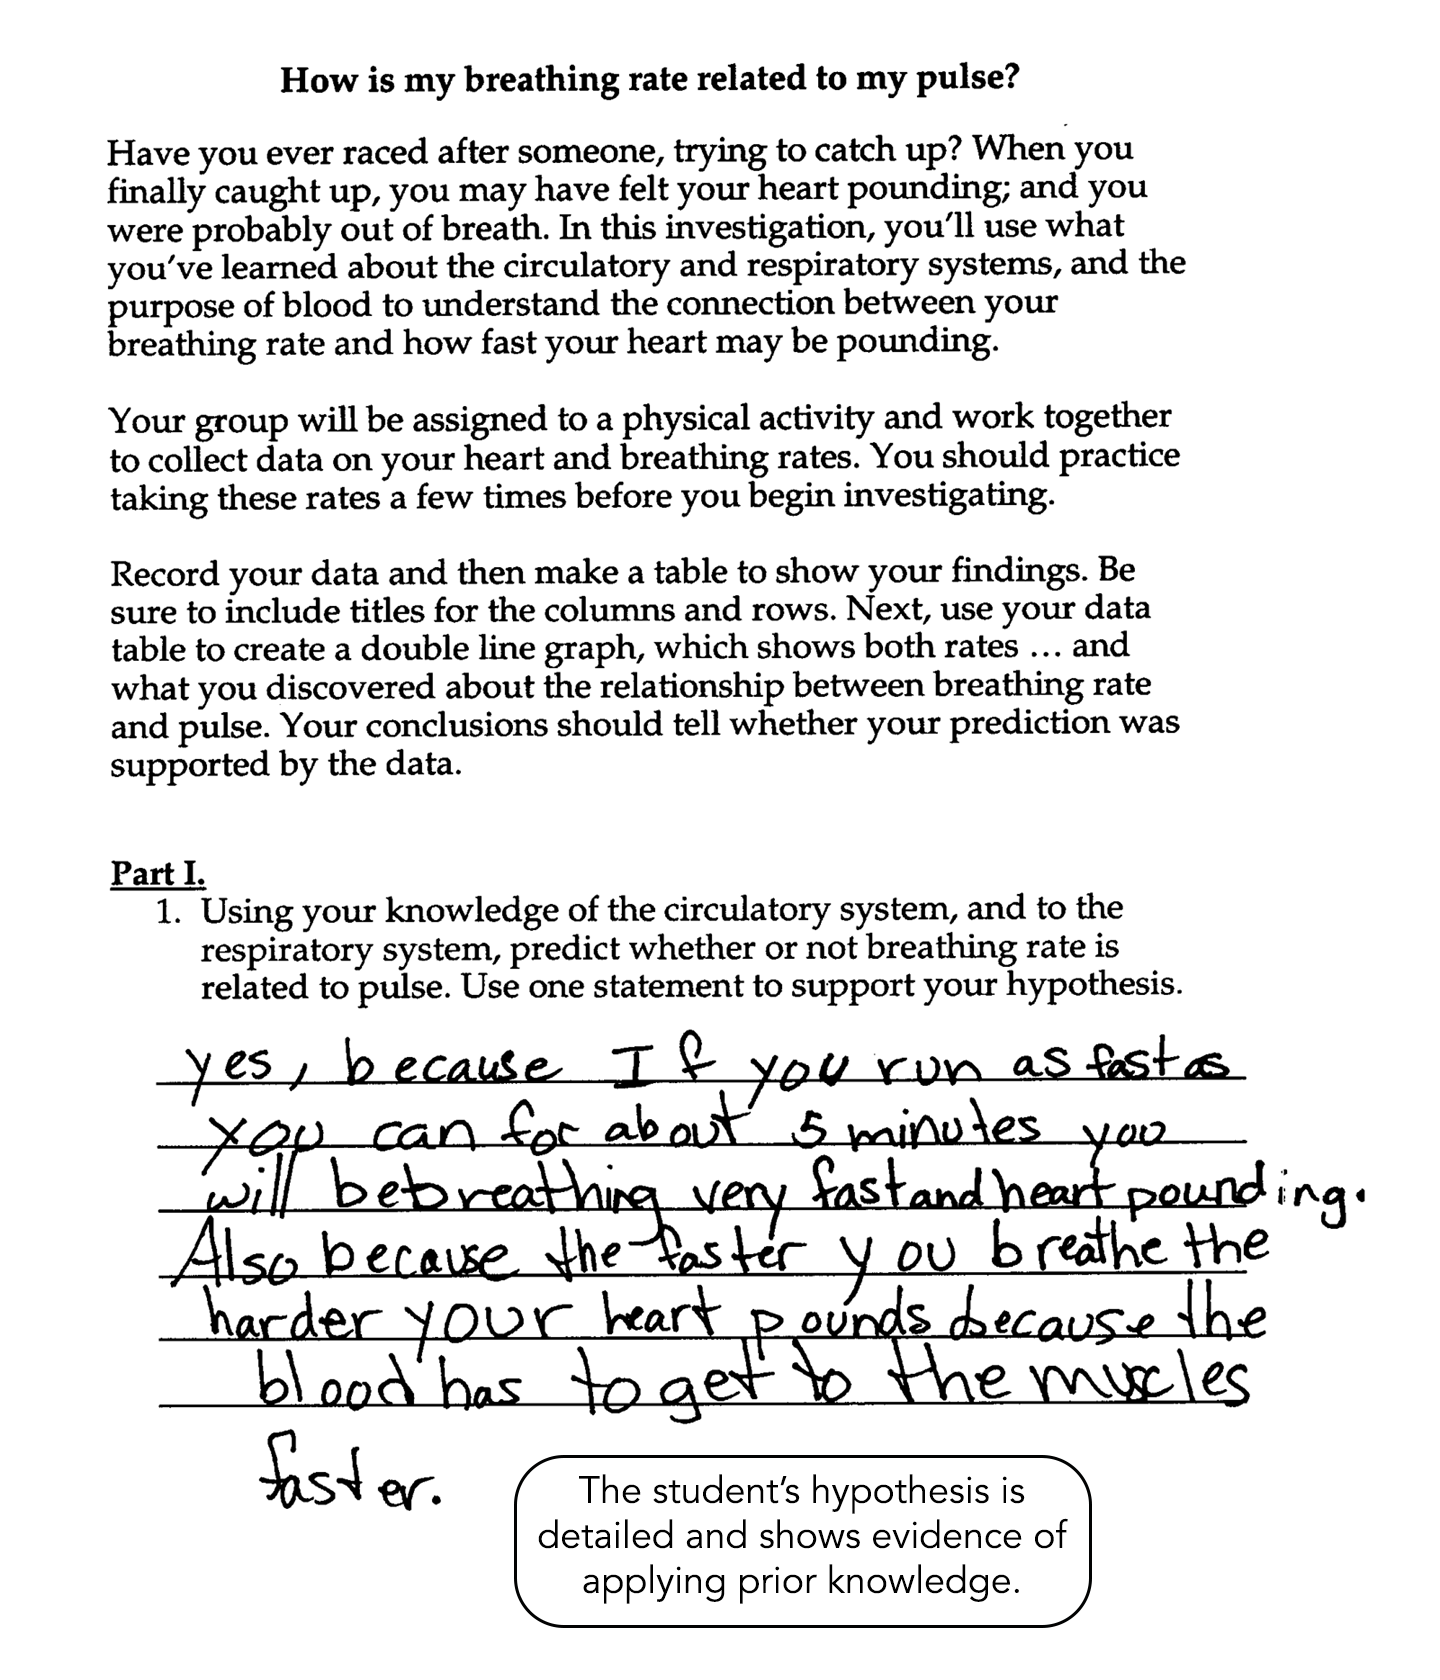
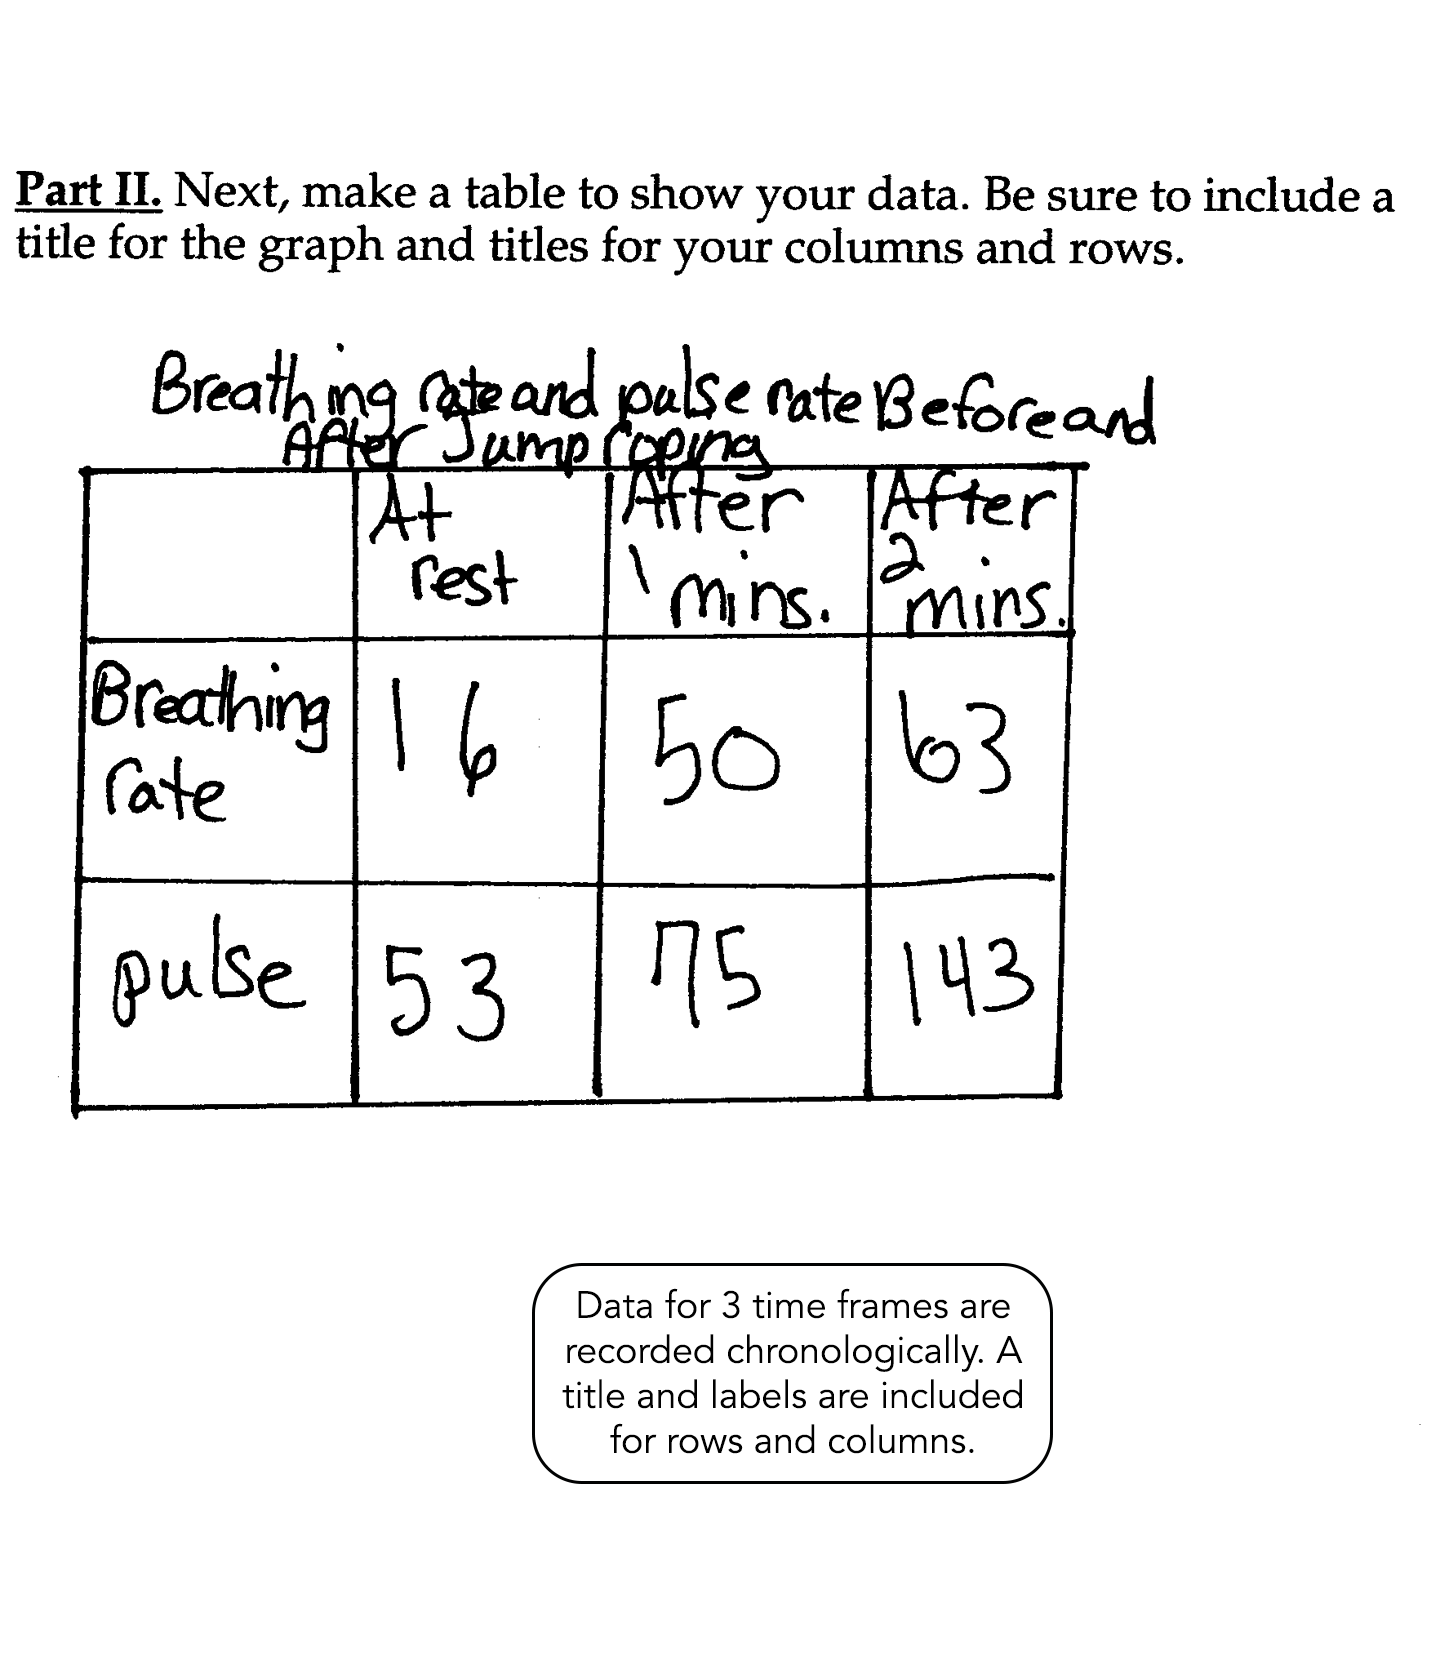
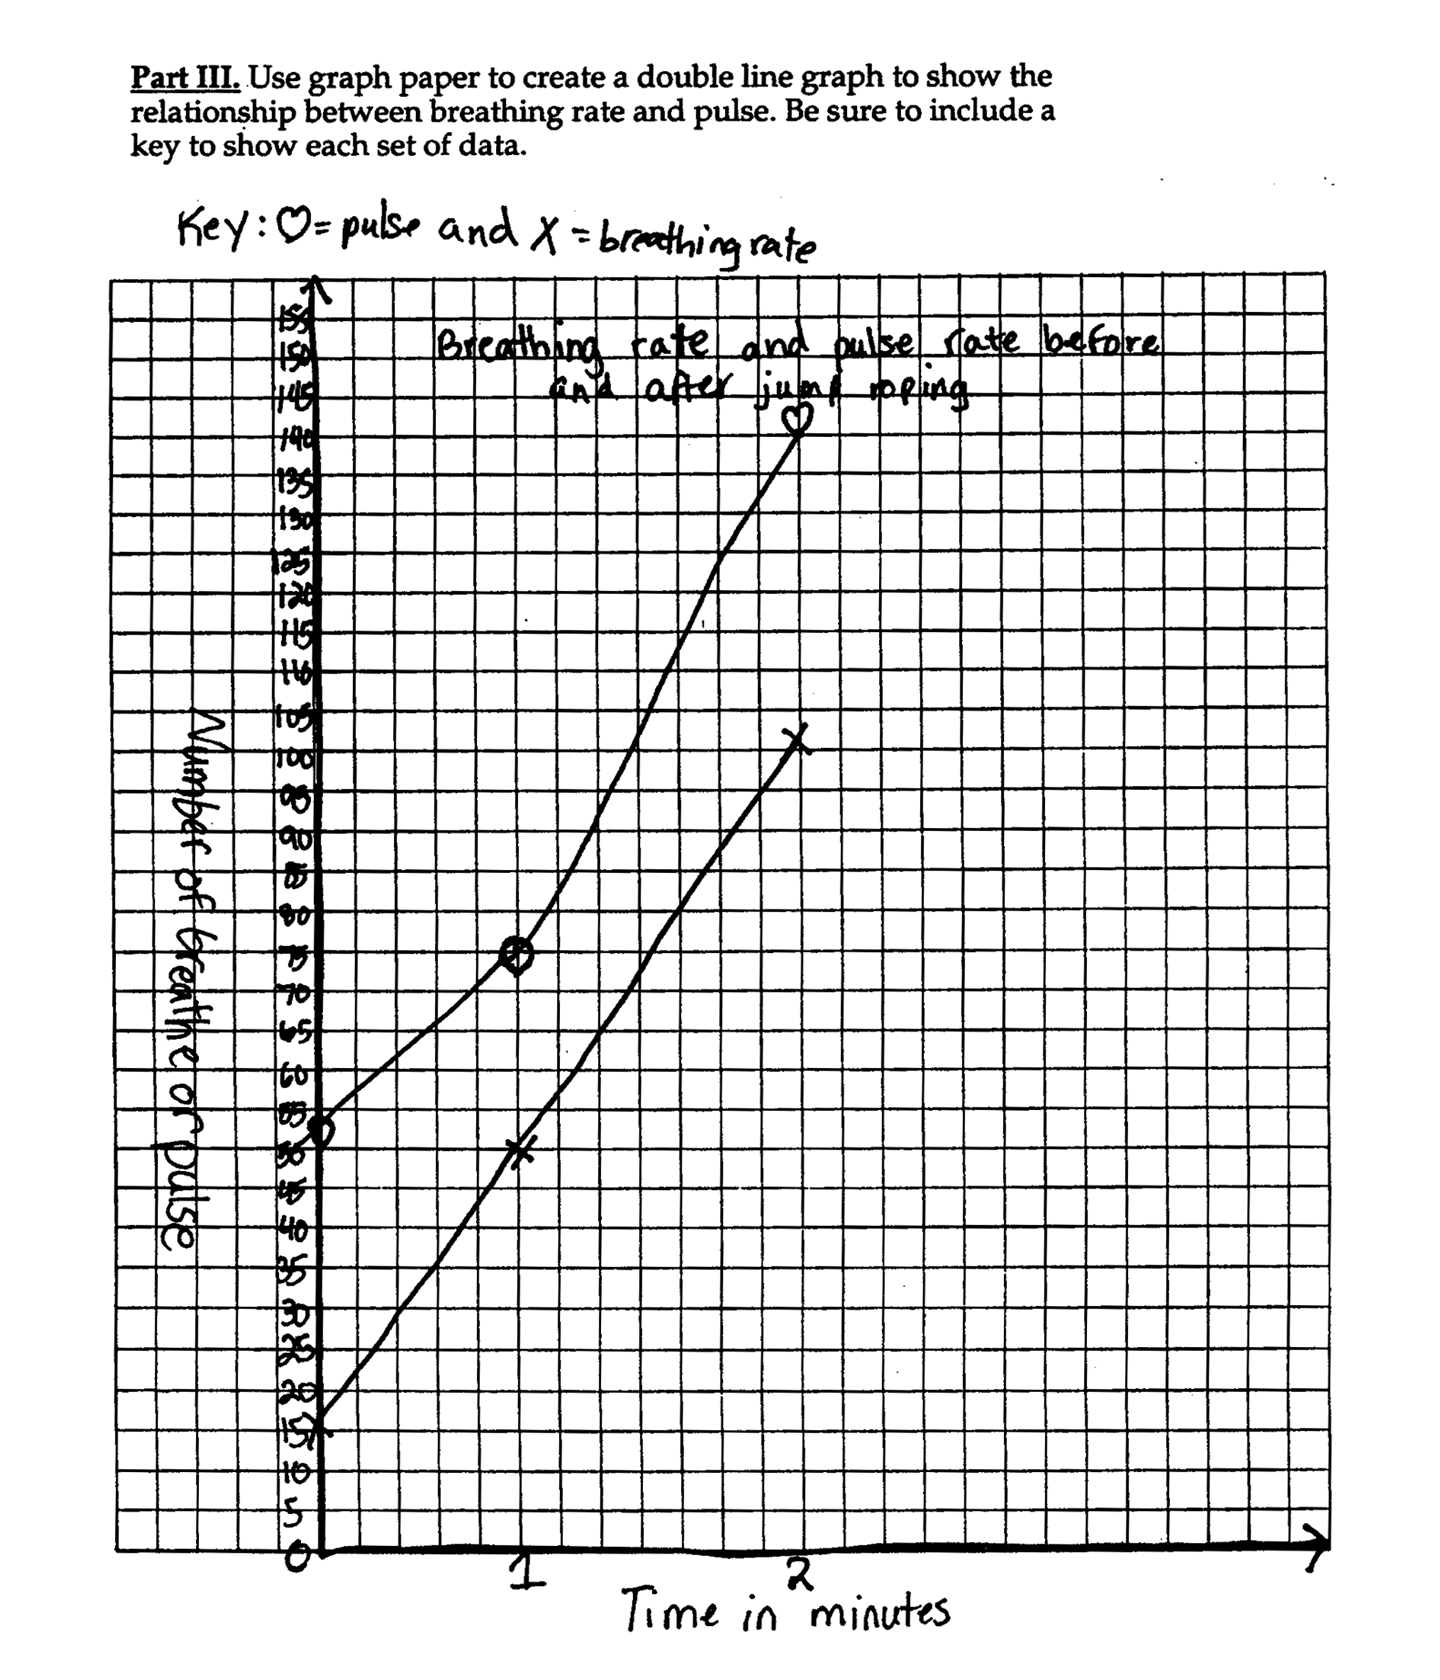
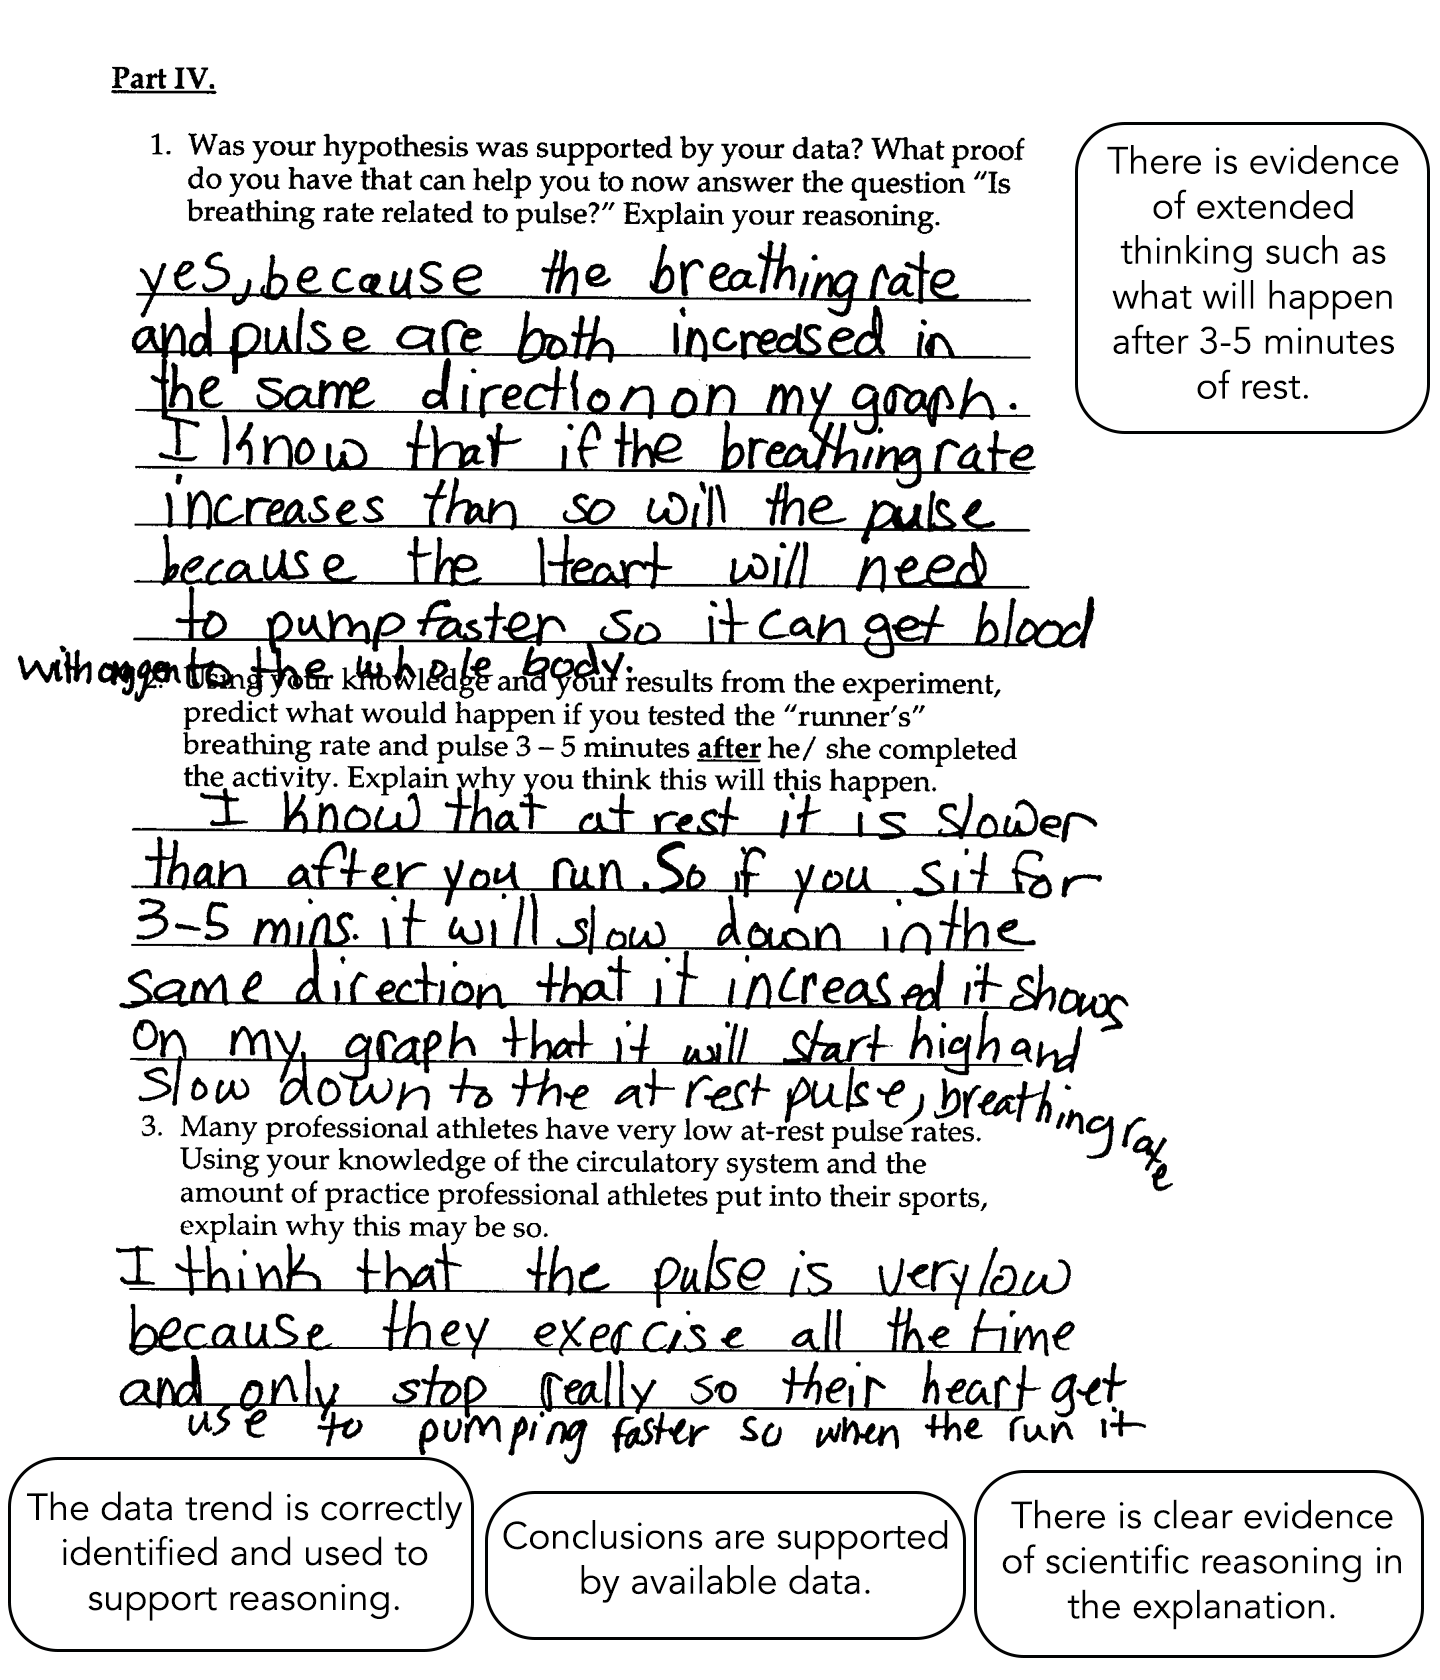
The student’s hypothesis (which states whether or not breathing rate is related to pulse) relates the respiratory system to the circulatory system. Examples show evidence of applying prior knowledge. The data table includes columns and rows, labels and a title. The table includes data for breathing rate and pulse rate for three time frames, recorded chronologically. Data appear to be accurate. A title and labels for the axes of the graph are included and accurate (including measurement). The scale for each axis is appropriate for the data collected and is shown correctly on the graph. The data are accurately translated from the table and plotted on the graph. A key is included on the graph to distinguish the two lines. There is clear evidence of scientific reasoning in the conclusion. Conclusions are supported by data. There is evidence of extended thinking, such as what might happen when the person rests three to five minutes. The data trend is correctly identified from the graph and used to support reasoning.